
Leaving the Register
Overview
In registration year 2025-26, 40 individuals were removed from the Register for fitness to teach reasons (2024-25: 25; 2023-24: 27; 2022-23: 40; 2021-22: 21). Of these, 12 related to the professional competence of provisionally registered teachers who failed to maintain the Standard for Provisional Registration or demonstrate they met the Standard for Full Registration. In 2024-25, Provisional Registration was removed from 8 teachers (2023-24: 13; 2022-23: 12; 2021-22: 7).
In registration year 2025-26, 539 individuals from the 2024-25 PU cohort were removed from the Register for non-completion of PU by the 31 October 2025 deadline.
Here is an overview of the individuals’ employment statuses at the time of removal (PU):
- 347 individuals (64.38%) were employed
- 5 individuals (0.93%) were signed up to supply
- 30 individuals (5.57%) were unemployed
The remaining 157 individuals (29.13%) were grouped into ‘Other/not known’ (Other or Blank).
Here is a breakdown of where individuals were employed at the time of removal (PU):
- 270 (50.09%) listed their employer as a local authority
- 18 (3.34%) listed their employer as in the Further Education sector
- 29 (5.38%) listed their employer as an Independent School
The remaining 222 (41.19%) individuals were grouped into ‘Other/not known’ (Non-UK Schools, Not Currently Working, Other, Supply Teaching, UK (Not Scotland), University or Blank).
The following local authorities had 10 or more individuals removed due to non-completion of PU:
- City of Edinburgh Council (35)
- South Lanarkshire Council (32)
- Stirling Council (24)
- Renfrewshire Council (16)
- Moray Council (13)
- Inverclyde Council (13)
- Aberdeenshire Council (11)
- Midlothian Council (11)
- Dundee City Council (10)
Data at 31 March tells us that since the removal (PU) exercise was performed, 177 individuals have returned to the Register (32.84%) of the total number removed (PU).
Data held indicates that these individuals’ employment statuses at the time of removal (PU) were:
- 144 individuals (81.36%) were employed
- 2 individuals (1.13%) were signed up to supply
- 6 individuals (3.39%) were unemployed
The remaining 25 individuals (14.12%) were grouped into ‘Other/not known’ (Other or Blank).
These individuals listed their employer as follows at the time of returning to the Register:
122 listed their employer as a local authority
- 22.63% of all removed for non-completion of PU (removed(PU))
- 45.19% of all local authority removed (PU)
6 listed their employer as in the Further Education sector
- 1.11% of all removed (PU)
- 33.33% of all Further Education removed (PU)
13 listed their employer as an Independent School
- 2.41% of all removed (PU)
- 44.83% of all removed (PU) whilst employed in an Independent School
The remaining 36 individuals were grouped into Other/not known (Non-UK Schools, Not Currently Working, Other, Supply Teaching, UK (Not Scotland), University or Blank).
- 6.68% of all removed (PU)
- 16.22% of all removed (PU) and grouped into ‘Other/not known’
The local authorities with the most individuals reinstated were:
- Stirling Council (17)
- South Lanarkshire Council (13)
- Moray Council (13)
Approximately 5% of registrants choose to leave the Register each year. GTC Scotland
contacts everyone leaving the Register and asks them to provide information about why they have chosen to do so.
Table 26 shows the number of registrants who have left or been removed from the Register (and have not returned) since 1 January 2019, following completion of an induction period and within 5 years of gaining provisional registration.
For context, most teachers join the Register with provisional registration from mid-July to mid-August each year. Registrants generally leave the Register on a specific date (which changes each year) between mid-July and mid-August when they are lapsed for non- payment of their registration fee.
{{fs-regreport26-table26="/section-components"}}
Background, survey and response rates
Between 1 April 2025 and 31 March 2026, 4,590 individuals left the Register. This number represents all those who left the Register and had not returned at the point the data was extracted.
A total of 549 ‘Leaving the Register of Teachers’ survey responses were submitted, representing 11.96% of all individuals leaving the Register in this period.
The survey asked the following:
- Please select your reason for leaving the Register of Teachers from the list below:
- What was your registration status when you left the Register? Select all that apply.
- In which registration category or categories were you registered when you left the Register?
- What stage of your teaching career were you in when you left the Register?
- SEX - What is your Sex?
- AGE - What was your age on your last birthday?
- GENDER/GENDER REASSIGNMENT - Do you consider yourself to be trans, or have trans history? Trans is a term used to describe people whose gender is not the same as the sex they were registered at birth.
- ETHNICITY - What is your ethnic group?
- NATIONALITY - Please select the country of your nationality.
- RELIGION - What religion, denomination or body do you belong to?
- SEXUAL ORIENTATION - Which of the following best describes your sexual orientation?
- DISABILITY/HEALTH - Do you have any of the following, which have lasted, or are expected to last, at least 12 months?
- CARING RESPONSIBILITIES - Do you have any caring responsibilities? Select all that apply.
- HARASSMENT – In your work as a teacher in the last 12 months before leaving the Register, did you experience bullying, harassment, racism or other discrimination?
- HARASSMENT - If yes, who did you experience bullying, harassment, racism or other discrimination from? Select all that apply.
We do not have a legal mandate to collect equality, diversity and inclusion (EDI) information that can be associated with individual registrants. However, anonymised EDI information can be collected to provide insights into the profession, identify trends and potential barriers, and inform policy development and decision-making. Respondents could choose to answer the questions they were willing to voluntarily complete.
Percentages shown in the ‘Reason for leaving’ to ‘Harassment’ sections show the number of respondents as a percentage of the total who responded to each question. Percentages shown in the ‘Combined data’ section use varying denominators and this is explained in that section.
Reason for leaving
{{fs-regreport26-table27="/section-components"}}
<span id="es-chart-01" class="table_caption" style="text-align:center; margin: auto; display: block; padding-top: 3.5rem;" fs-test-element="reg-report-title-es-chart-01">Chart 10: Reason for leaving</span>
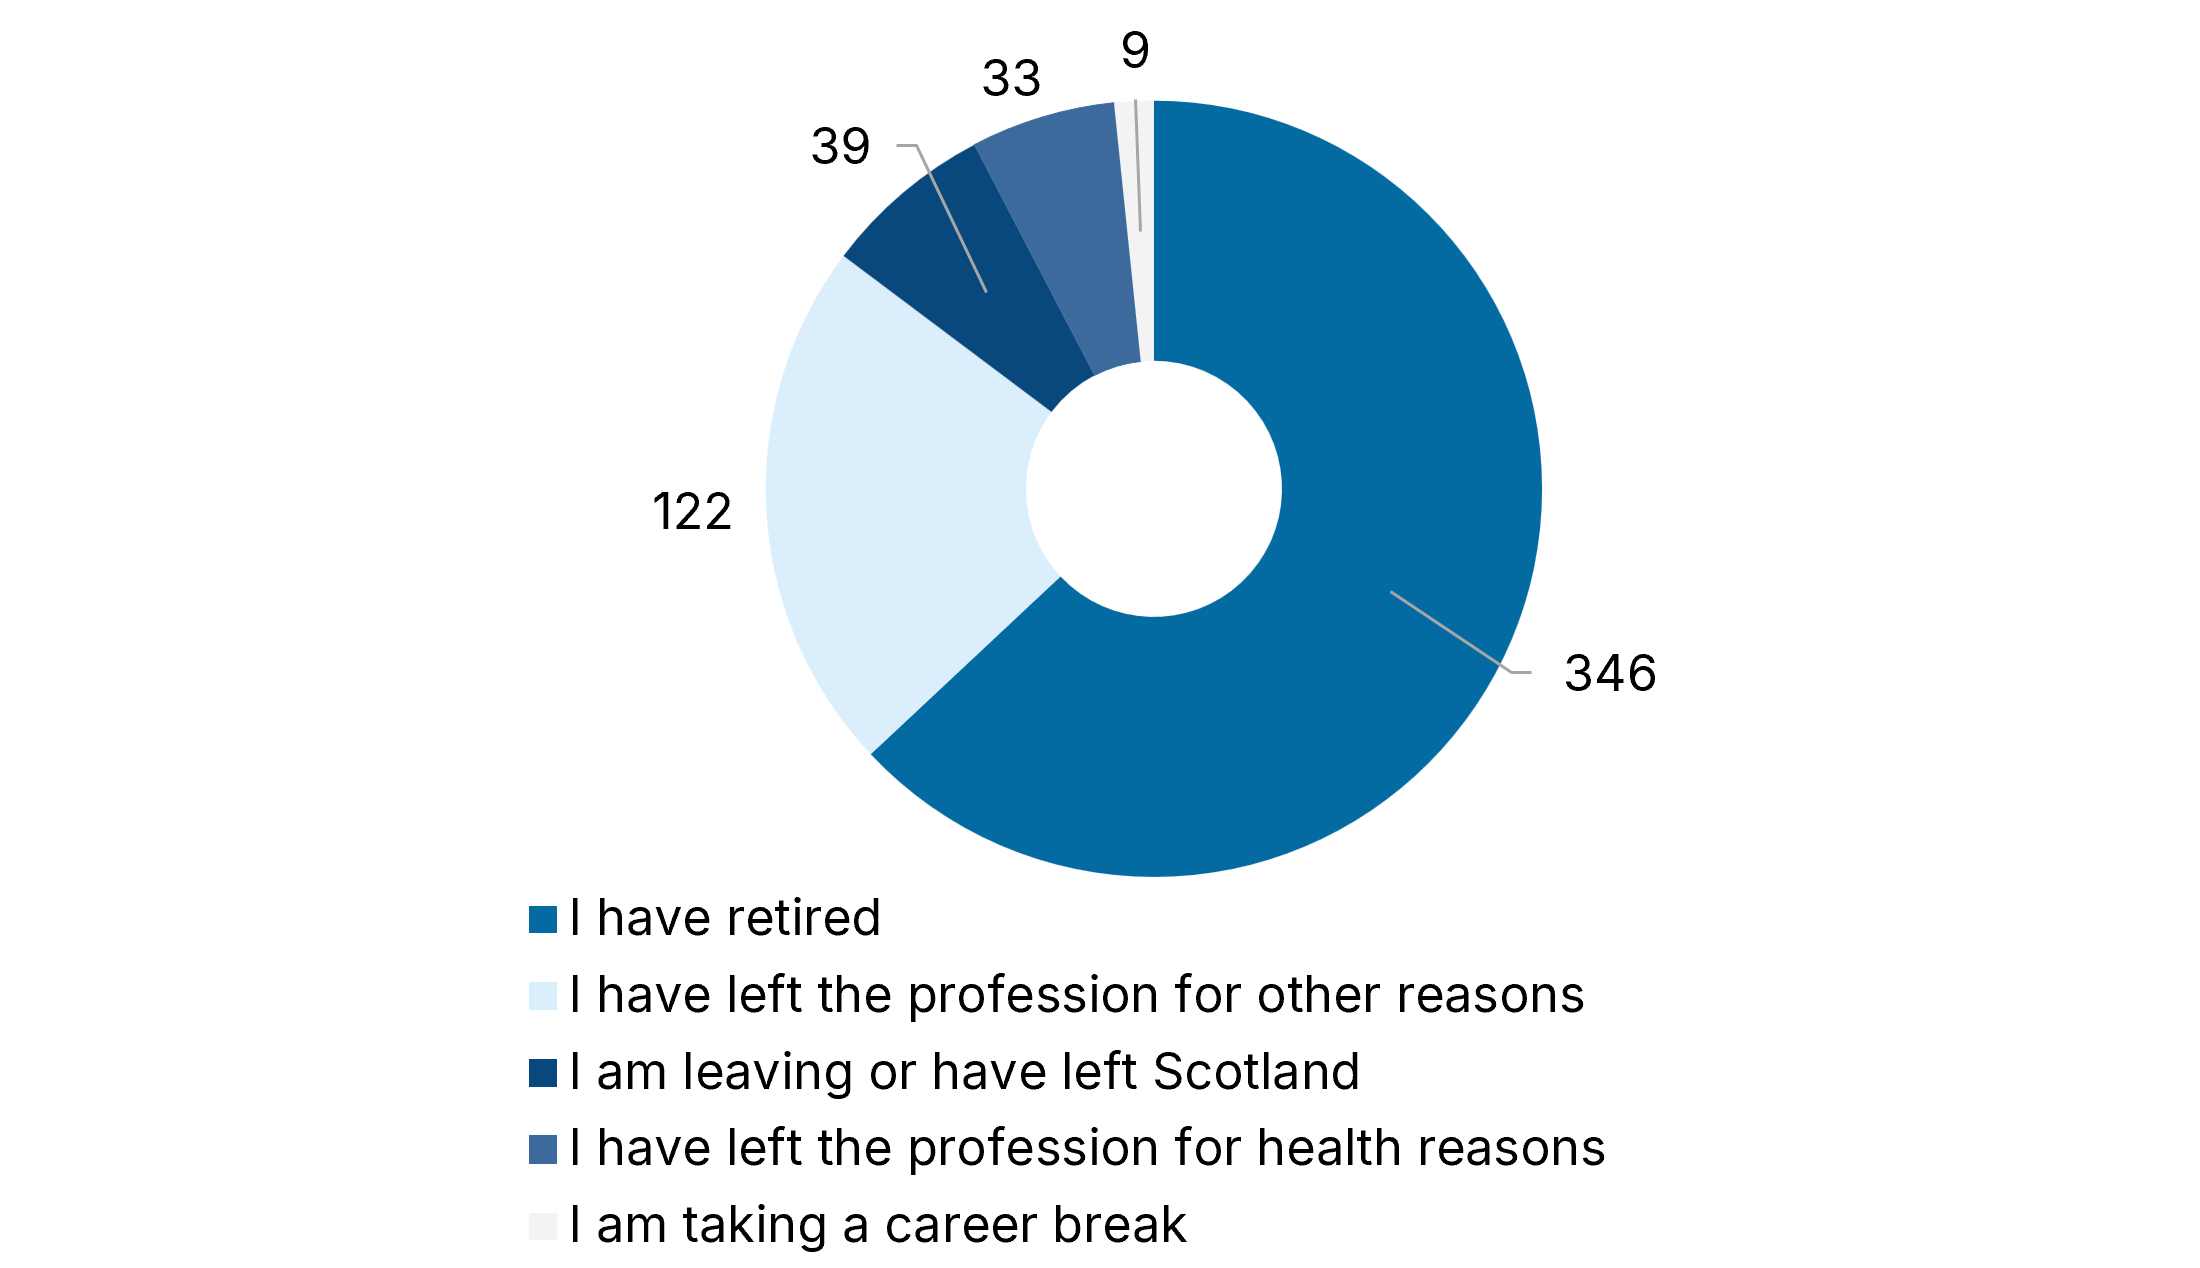
63% (346) of those who responded left the Register due to retirement (63% in 2024-25,
58% in 2023-24). The next largest group (122, 22%) noted other reasons (21% in 2024-25,
24% in 2023-24). Of the 122 respondents who selected ‘other reasons’, 116 included additional text to support this. The most common additional reason for leaving (32) cited ‘stress’ or ‘burnout’. In addition, 28 registrants who selected ‘other reasons’ for leaving the Register shared information that their decision related to pupil behaviour, violence and/or additional support needs. A further 27 cited a lack of support. This included lack of support during their period of provisional registration, lack of support from leadership teams and lack of support in the classroom, particularly in relation to children and young people with additional support needs. 25 individuals that left the Register cited problems with securing a post as their reason; be it a permanent post, sufficient work to achieve Full Registration requirements via the Flexible Route or gain a post once fully registered. 24 registrants noted the effect of workload or unnecessary bureaucracy on their decision. 10 respondents referred to bullying from colleagues or leadership had led to their choice.
Data previously gathered in 2024-25 where ‘other reasons’ were cited as the reason for leaving the Register indicated the most common reasons as lack of support, lack of job opportunities, the effect of workload or unnecessary bureaucracy, pupil behaviour, and bullying from colleagues or leadership.
Data previously gathered in 2023-24 where ‘other reasons’ were cited as the reason for leaving the Register indicated the most common reasons as lack of job opportunities, lack of support, the effect of workload or unnecessary bureaucracy, pupil behaviour, and bullying from colleagues or leadership.
Registration Status
{{fs-regreport26-table28="/section-components"}}
<span id="es-chart-01" class="table_caption" style="text-align:center; margin: auto; display: block; padding-top: 3.5rem;" fs-test-element="reg-report-title-es-chart-01">Chart 11: Registration Status at time of leaving</span>
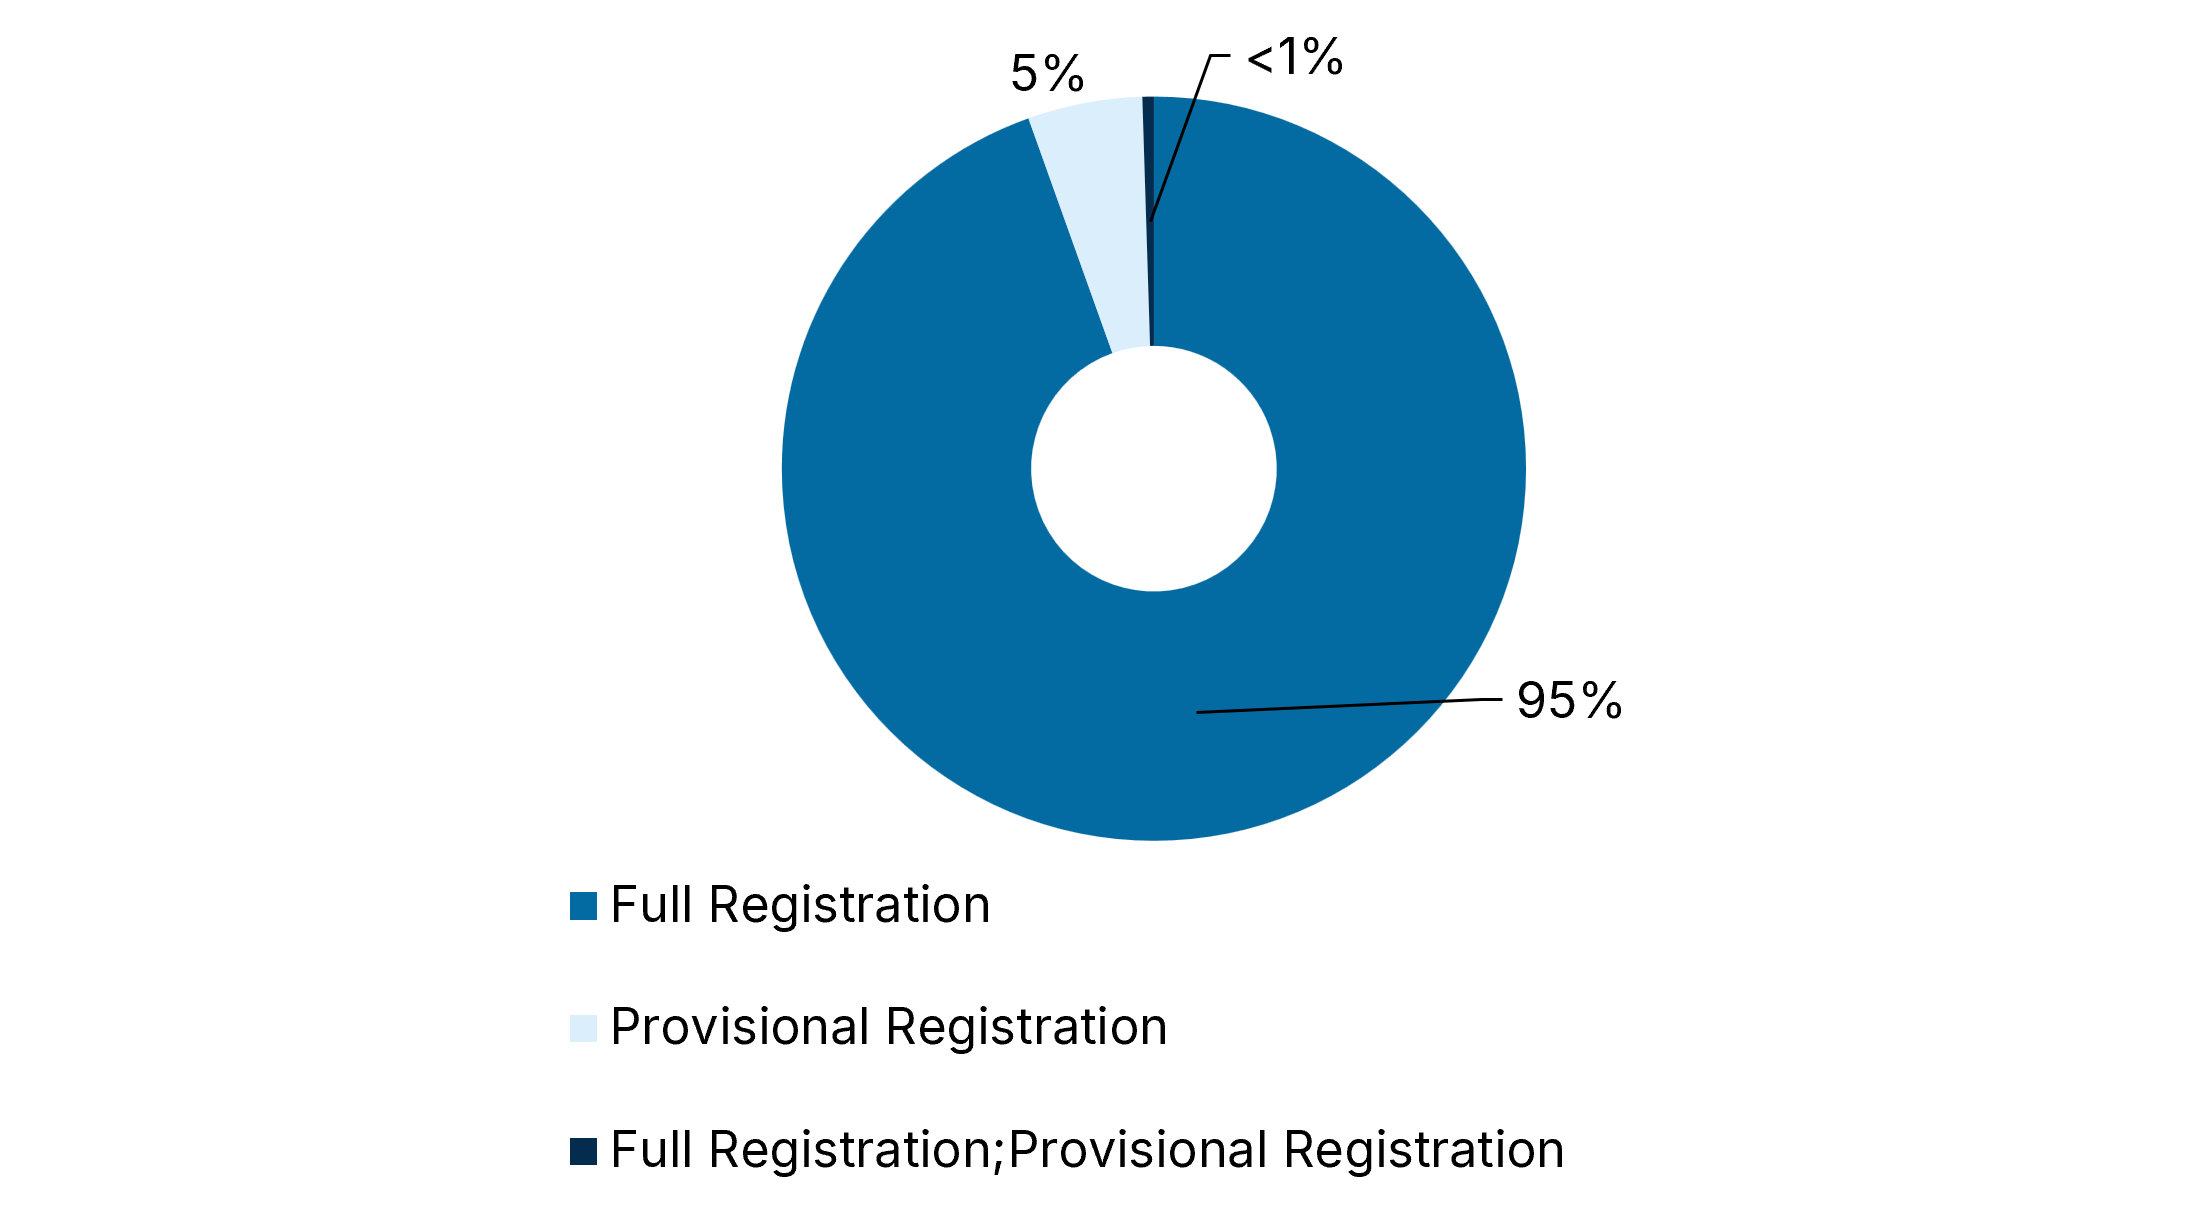
95% of respondents (522 including those who selected both Full Registration and Full and Provisional Registration options) held Full Registration in at least one category.
Registration Category
Respondents were asked to select the registration categories in which they held registration; these are reported in Table 29. As with all questions in this survey, the results are self-reported and cannot be checked for accuracy due to the anonymous nature of the survey.
{{fs-regreport26-table29="/section-components"}}
Of the 549 respondents, 489 (89%) held registration in one category; 56 (10%) in two categories; and 2 (<1%) in three or four categories.
<span id="es-chart-01" class="table_caption" style="text-align:center; margin: auto; display: block; padding-top: 3.5rem;" fs-test-element="reg-report-title-es-chart-01">Chart 12: Registrations held at time of leaving</span>
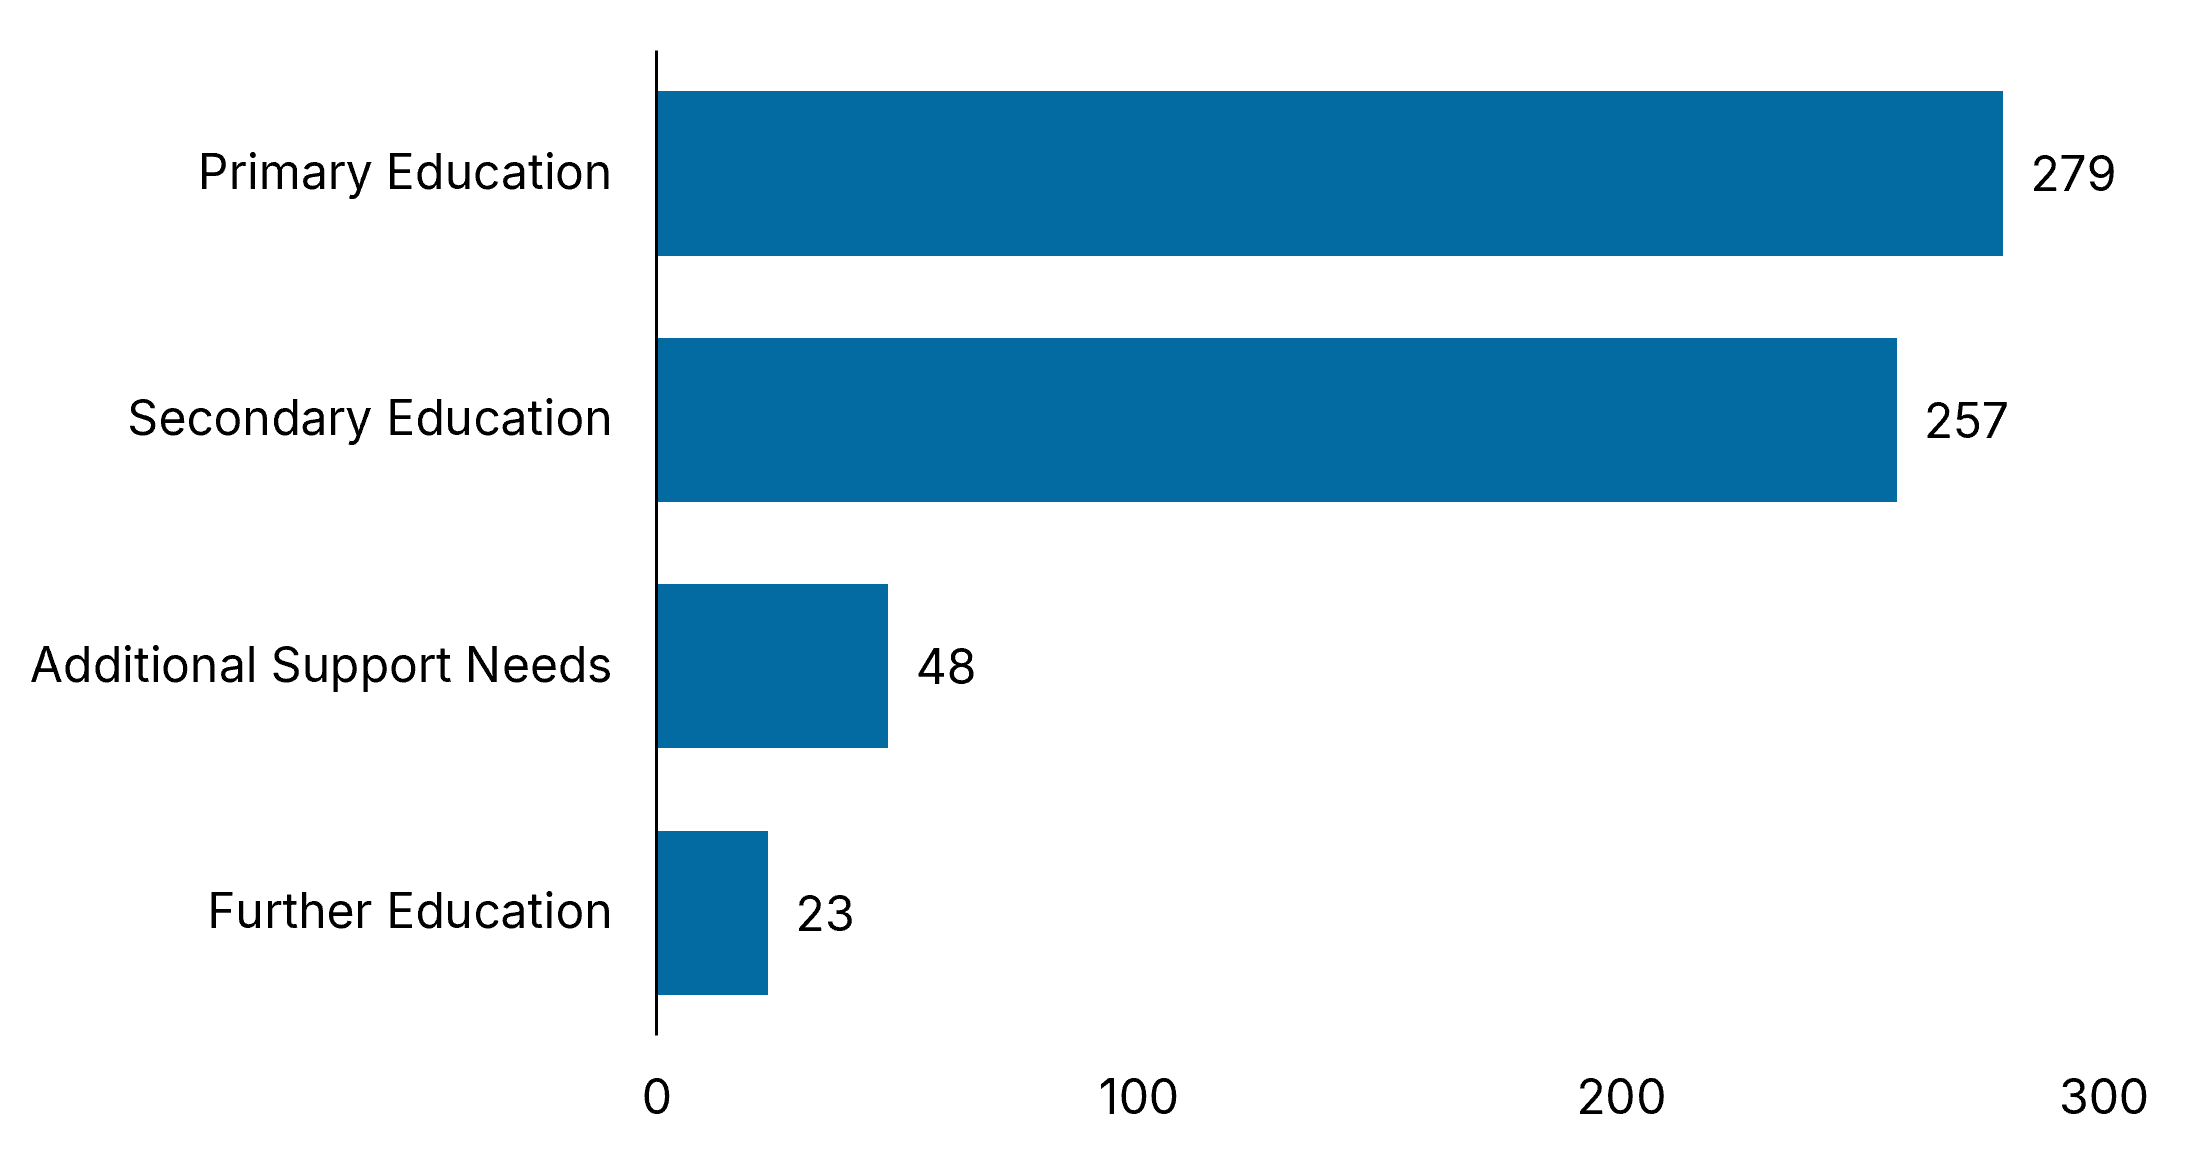
Chart 12 shows the total number of registrations (607) held in each category by respondents to the survey. The greatest number of registrations were in Primary Education with Secondary (Subject) Education the next biggest group.
Stage of Career
{{fs-regreport26-table30="/section-components"}}
The largest group were those who had held Full Registration for 5 or more years. 24 individuals (4%) lapsed before gaining Full Registration.
Table 26, under the ‘Leaving the Register – Overview’ section, gives information about all registrants who have left or been removed from the Register (and have not returned) since 1 January 2019, following completion of an induction period and within 5 years of gaining Provisional Registration. This data shows that since January 2021 an increasing number of these teachers have left the Register and have not returned.
Sex
{{fs-regreport26-table31="/section-components"}}
<span id="es-chart-01" class="table_caption" style="text-align:center; margin: auto; display: block; padding-top: 3.5rem;" fs-test-element="reg-report-title-es-chart-01">Chart 13: Sex</span>
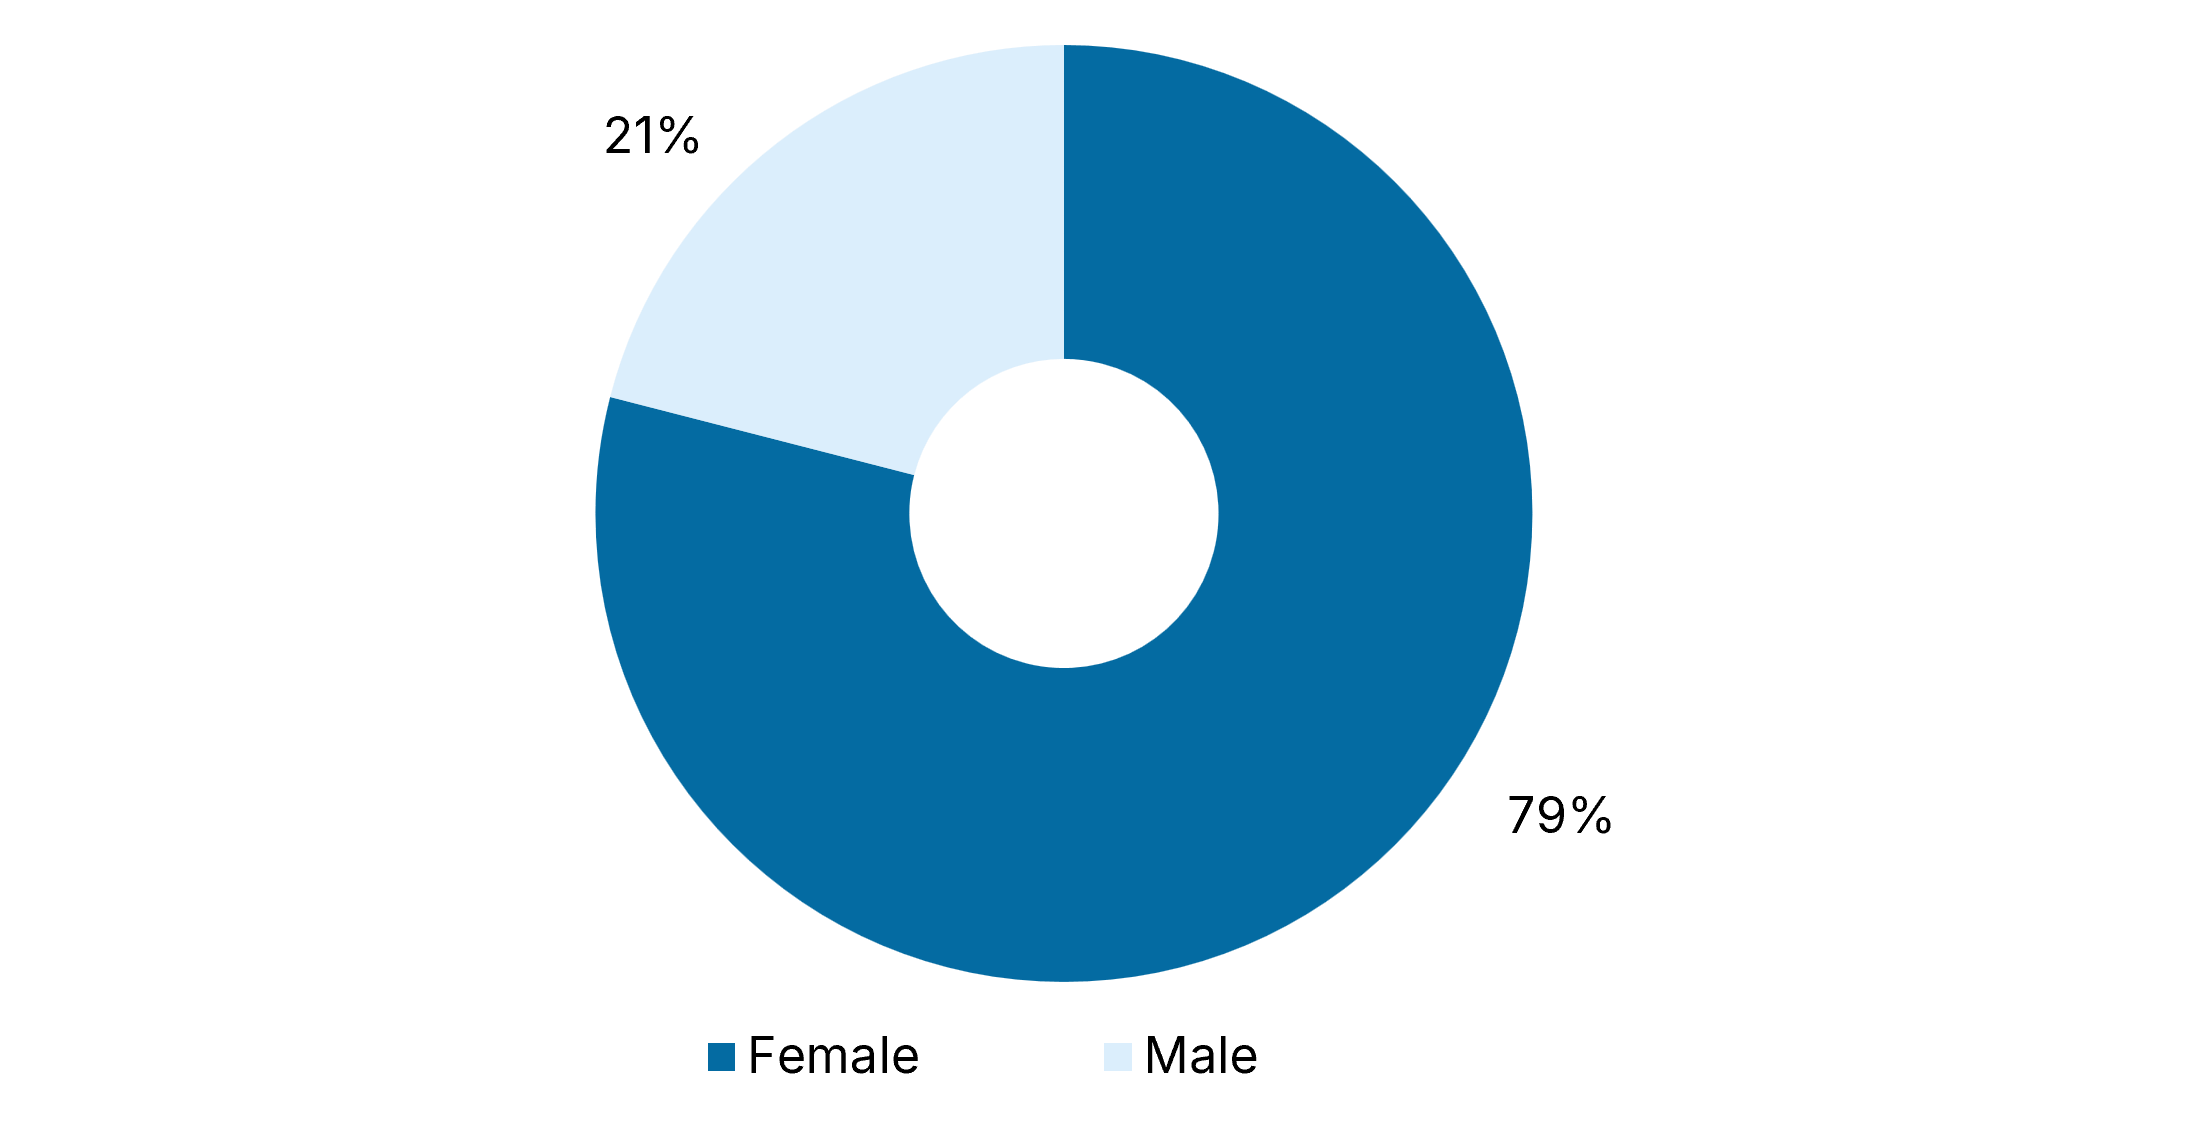
79% of registrants who left the Register were female. The remaining 21% were male. 4 respondents chose to skip this question. On the Register as a whole, 77% of registrants are female and 22% of registrants are male. On the Scottish Government teacher census 2025, 77% of teachers are female.
Age at time of leaving
{{fs-regreport26-table32="/section-components"}}
<span id="es-chart-01" class="table_caption" style="text-align:center; margin: auto; display: block; padding-top: 3.5rem;" fs-test-element="reg-report-title-es-chart-01">Chart 14: Age at time of leaving</span>
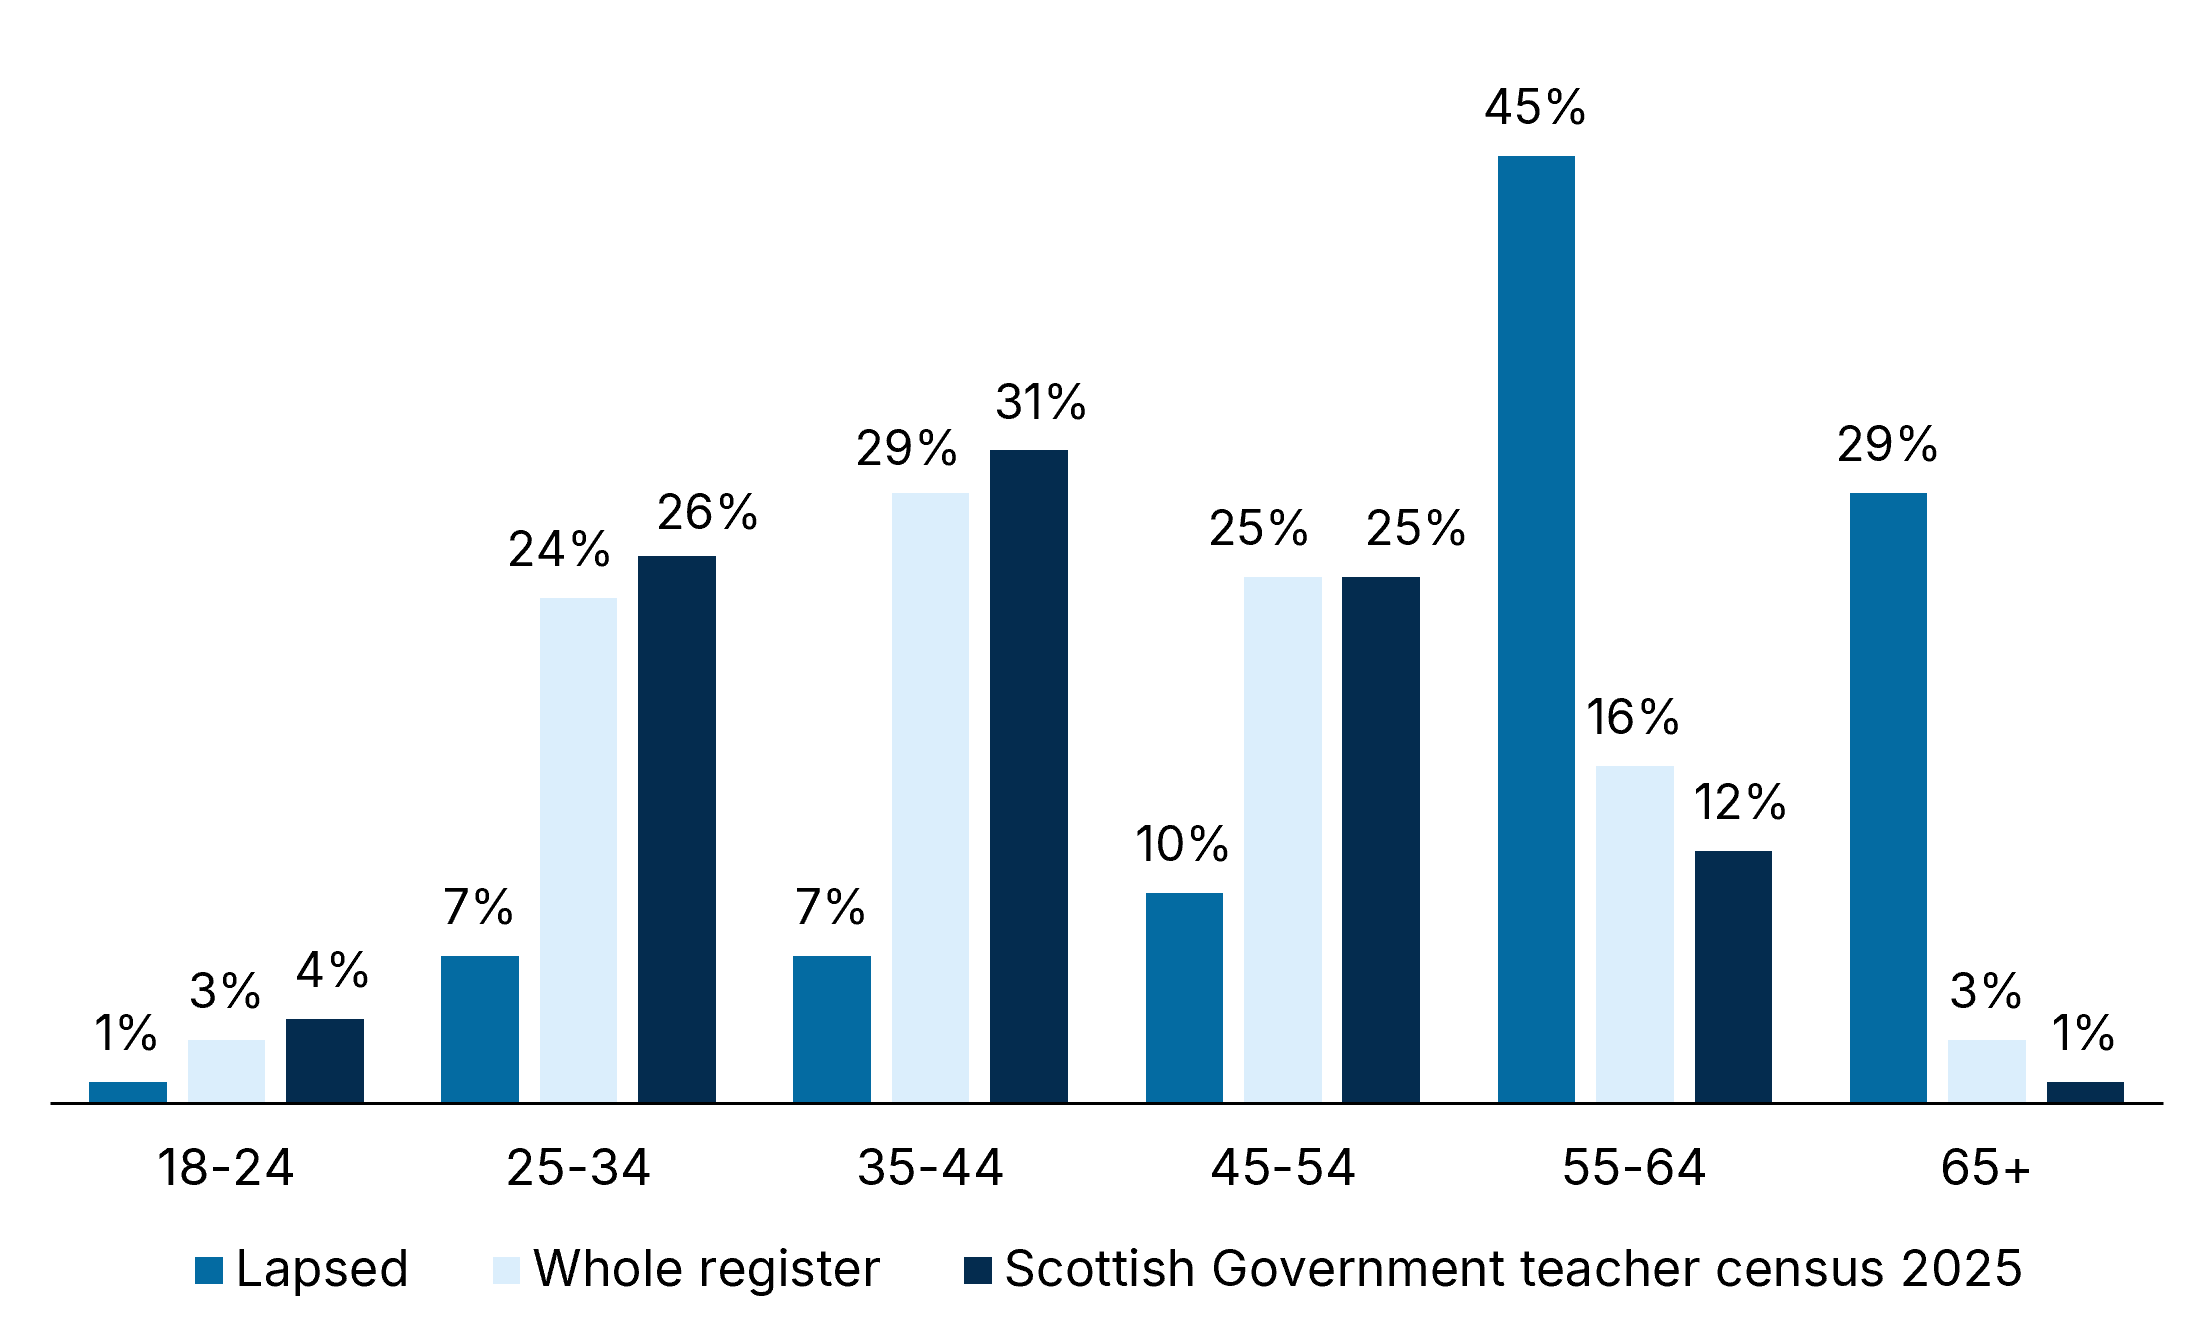
74% of respondents were over the age of 55 when they left the Register. Chart 14 shows the percentage in each age group compared to the Register as a whole and the Scottish Government teacher census 2025.
Gender/Gender reassignment
When asked if they consider themselves to be trans or have a trans history, 547 of respondents stated ‘No’ and 2 respondents selected ‘Yes’. For those who selected ‘Yes’, when asked to describe their trans status, one answered ‘non-binary’ whereas the other answered ‘trans woman’.
Ethnicity
{{fs-regreport26-table33="/section-components"}}
Table 33 shows that the majority of respondents have an ethnicity of ‘White – Scottish’ (80%). 8 respondents chose to skip the Ethnicity section.
Nationality
{{fs-regreport26-table34="/section-components"}}
Table 34 shows that the majority of respondents were British (92%).
43 respondents chose ‘Other’ as their nationality. 28 of the 43 respondents chose to write their nationality.
{{fs-regreport26-table35="/section-components"}}
Religion
{{fs-regreport26-table36="/section-components"}}
Table 36 shows that 42% of respondents do not have a religion. 29% of respondents selected Church of Scotland and 18% chose Roman Catholic as their answer. Eight respondents chose to skip the Religion section.
The number of respondents who selected Other Christian as their answer was 48. Of those, 44 respondents chose to provide more information. Church of England and Christian were mentioned 9 and 8 times respectively. Baptist was given as an answer 4 times.
Five respondents chose Another religion or body. Humanist was mentioned twice, whereas Brahma Kumaris, Episcopal and Personal beliefs were provided as answers too.
Sexual Orientation
{{fs-regreport26-table37="/section-components"}}
Table 37 shows that most respondents (502, 95%) have a sexual orientation of straight/heterosexual. Twelve (2%) respondents are bisexual, and 10 (2%) others are gay or lesbian. Finally, 5 individuals responded that they have another sexual orientation. Asexual, Pansexual and Queer were all provided as answers.
Disability/Health
{{fs-regreport26-table38="/section-components"}}
Table 38 shows that the majority (386, 73%) of respondents have no condition or disability that affects their health. Respondents with a long-term illness, disease or condition (one that they may have for life, which may be managed with treatment or medication) make up 9% of the responses.
Caring Responsibilities
{{fs-regreport26-table39="/section-components"}}
Table 39 shows that the majority of respondents do not have caring responsibilities in their personal lives. Of the respondents that have one type of caring responsibility, 55 (10%) have a responsibility as a carer or assistant for an older person or people (65 years and over), whereas 46 (9%) respondents have a responsibility as a carer of a child or children (under 18 years). Furthermore, 10 (2%) individuals are the carer or assistant for a disabled adult (18 years and over).
Harassment
{{fs-regreport26-table40="/section-components"}}
Table 40 reveals that 93 respondents (17%) experienced harassment in their work as a teacher in the last 12 months before leaving the Register.
{{fs-regreport26-table41="/section-components"}}
Table 41 shows that of the 93 respondents who experienced harassment in their work as a teacher in the last 12 months before leaving the Register, 40 (93%) mentioned it was received from colleagues whereas 24 (26%) respondents stated the source was learners.
Combined data
Tables 42a and 42b show the breakdown of reason for leaving by age group. Percentages in table 43a use the total number of respondents in that age group as the denominator e.g. the percentage shown in 42a for the registrants aged 18-24 who indicated that they left the Register because they are leaving or have left Scotland uses the total number of respondents in the age category 18-24 as the denominator. Percentages in table 42b use the total number of respondents across all age groups who gave that reason for leaving as the denominator. For example, in table 42a below, 1 individual aged 18-24 said that they taking a career break. 17% of all 18-24 year-olds gave this as their reason for leaving the Register. Table 42b shows that 31% of everyone (of all ages) who gave ‘I am leaving or have left Scotland’ as a reason for leaving the Register were aged 25-34.
{{fs-regreport26-table42a="/section-components"}}
{{fs-regreport26-table42b="/section-components"}}
Tables 43a and 43b show the breakdown of reason for leaving by stage of career. Percentages in table 43a the total number of respondents in that career stage, as the denominator. For example, the percentage shown in table 43a for the registrants by stage of career who indicated that they left the Register because they are leaving or have left Scotland uses the total number of respondents in that stage of career as the denominator. Percentages in table 43b use the total number of respondents who gave that reason for leaving across all career stages, as the denominator (see example in Table 42 for further explanation if required).
{{fs-regreport26-table43a="/section-components"}}
{{fs-regreport26-table43b="/section-components"}}
The most common reason for leaving the Register for registrants who were fully registered for 5 or more years was retirement (71%) with 99% of all those leaving due to retirement being in this career stage.
For those in the early career stage, the most common reason for leaving the Register was leaving the profession for other reasons (53%) with the second most common reason being that they were leaving or had already left Scotland (28%). Of the 21 respondents in the early career group who selected ‘other reasons’, 11 (52% of this group) mentioned difficulties securing a post, 4 attributed it to stress (19% of this group) and 3 cited workload (14% of this group).
There were similar reported results for those who left the Register who were provisionally registered with 67% of these respondents leaving the profession for other reasons and with a further 17% leaving due to leaving or having left Scotland. ‘Other reasons’ in this group (16 respondents) cited lack of support (6; 38%) and difficulty securing a post (8; 50%). 3 respondents in this group (19%) also cited bullying as a factor.
It should be noted that respondents could give several ‘other’ reasons for leaving the Register and so multiple factors may be attributed to each individual.
Overview
In registration year 2025-26, 40 individuals were removed from the Register for fitness to teach reasons (2024-25: 25; 2023-24: 27; 2022-23: 40; 2021-22: 21). Of these, 12 related to the professional competence of provisionally registered teachers who failed to maintain the Standard for Provisional Registration or demonstrate they met the Standard for Full Registration. In 2024-25, Provisional Registration was removed from 8 teachers (2023-24: 13; 2022-23: 12; 2021-22: 7).
In registration year 2025-26, 539 individuals from the 2024-25 PU cohort were removed from the Register for non-completion of PU by the 31 October 2025 deadline.
Here is an overview of the individuals’ employment statuses at the time of removal (PU):
- 347 individuals (64.38%) were employed
- 5 individuals (0.93%) were signed up to supply
- 30 individuals (5.57%) were unemployed
The remaining 157 individuals (29.13%) were grouped into ‘Other/not known’ (Other or Blank).
Here is a breakdown of where individuals were employed at the time of removal (PU):
- 270 (50.09%) listed their employer as a local authority
- 18 (3.34%) listed their employer as in the Further Education sector
- 29 (5.38%) listed their employer as an Independent School
The remaining 222 (41.19%) individuals were grouped into ‘Other/not known’ (Non-UK Schools, Not Currently Working, Other, Supply Teaching, UK (Not Scotland), University or Blank).
The following local authorities had 10 or more individuals removed due to non-completion of PU:
- City of Edinburgh Council (35)
- South Lanarkshire Council (32)
- Stirling Council (24)
- Renfrewshire Council (16)
- Moray Council (13)
- Inverclyde Council (13)
- Aberdeenshire Council (11)
- Midlothian Council (11)
- Dundee City Council (10)
Data at 31 March tells us that since the removal (PU) exercise was performed, 177 individuals have returned to the Register (32.84%) of the total number removed (PU).
Data held indicates that these individuals’ employment statuses at the time of removal (PU) were:
- 144 individuals (81.36%) were employed
- 2 individuals (1.13%) were signed up to supply
- 6 individuals (3.39%) were unemployed
The remaining 25 individuals (14.12%) were grouped into ‘Other/not known’ (Other or Blank).
These individuals listed their employer as follows at the time of returning to the Register:
122 listed their employer as a local authority
- 22.63% of all removed for non-completion of PU (removed(PU))
- 45.19% of all local authority removed (PU)
6 listed their employer as in the Further Education sector
- 1.11% of all removed (PU)
- 33.33% of all Further Education removed (PU)
13 listed their employer as an Independent School
- 2.41% of all removed (PU)
- 44.83% of all removed (PU) whilst employed in an Independent School
The remaining 36 individuals were grouped into Other/not known (Non-UK Schools, Not Currently Working, Other, Supply Teaching, UK (Not Scotland), University or Blank).
- 6.68% of all removed (PU)
- 16.22% of all removed (PU) and grouped into ‘Other/not known’
The local authorities with the most individuals reinstated were:
- Stirling Council (17)
- South Lanarkshire Council (13)
- Moray Council (13)
Approximately 5% of registrants choose to leave the Register each year. GTC Scotland
contacts everyone leaving the Register and asks them to provide information about why they have chosen to do so.
Table 26 shows the number of registrants who have left or been removed from the Register (and have not returned) since 1 January 2019, following completion of an induction period and within 5 years of gaining provisional registration.
For context, most teachers join the Register with provisional registration from mid-July to mid-August each year. Registrants generally leave the Register on a specific date (which changes each year) between mid-July and mid-August when they are lapsed for non- payment of their registration fee.
{{fs-regreport26-table26="/section-components"}}
Background, survey and response rates
Between 1 April 2025 and 31 March 2026, 4,590 individuals left the Register. This number represents all those who left the Register and had not returned at the point the data was extracted.
A total of 549 ‘Leaving the Register of Teachers’ survey responses were submitted, representing 11.96% of all individuals leaving the Register in this period.
The survey asked the following:
- Please select your reason for leaving the Register of Teachers from the list below:
- What was your registration status when you left the Register? Select all that apply.
- In which registration category or categories were you registered when you left the Register?
- What stage of your teaching career were you in when you left the Register?
- SEX - What is your Sex?
- AGE - What was your age on your last birthday?
- GENDER/GENDER REASSIGNMENT - Do you consider yourself to be trans, or have trans history? Trans is a term used to describe people whose gender is not the same as the sex they were registered at birth.
- ETHNICITY - What is your ethnic group?
- NATIONALITY - Please select the country of your nationality.
- RELIGION - What religion, denomination or body do you belong to?
- SEXUAL ORIENTATION - Which of the following best describes your sexual orientation?
- DISABILITY/HEALTH - Do you have any of the following, which have lasted, or are expected to last, at least 12 months?
- CARING RESPONSIBILITIES - Do you have any caring responsibilities? Select all that apply.
- HARASSMENT – In your work as a teacher in the last 12 months before leaving the Register, did you experience bullying, harassment, racism or other discrimination?
- HARASSMENT - If yes, who did you experience bullying, harassment, racism or other discrimination from? Select all that apply.
We do not have a legal mandate to collect equality, diversity and inclusion (EDI) information that can be associated with individual registrants. However, anonymised EDI information can be collected to provide insights into the profession, identify trends and potential barriers, and inform policy development and decision-making. Respondents could choose to answer the questions they were willing to voluntarily complete.
Percentages shown in the ‘Reason for leaving’ to ‘Harassment’ sections show the number of respondents as a percentage of the total who responded to each question. Percentages shown in the ‘Combined data’ section use varying denominators and this is explained in that section.
Reason for leaving
{{fs-regreport26-table27="/section-components"}}
<span id="es-chart-01" class="table_caption" style="text-align:center; margin: auto; display: block; padding-top: 3.5rem;" fs-test-element="reg-report-title-es-chart-01">Chart 10: Reason for leaving</span>
63% (346) of those who responded left the Register due to retirement (63% in 2024-25,
58% in 2023-24). The next largest group (122, 22%) noted other reasons (21% in 2024-25,
24% in 2023-24). Of the 122 respondents who selected ‘other reasons’, 116 included additional text to support this. The most common additional reason for leaving (32) cited ‘stress’ or ‘burnout’. In addition, 28 registrants who selected ‘other reasons’ for leaving the Register shared information that their decision related to pupil behaviour, violence and/or additional support needs. A further 27 cited a lack of support. This included lack of support during their period of provisional registration, lack of support from leadership teams and lack of support in the classroom, particularly in relation to children and young people with additional support needs. 25 individuals that left the Register cited problems with securing a post as their reason; be it a permanent post, sufficient work to achieve Full Registration requirements via the Flexible Route or gain a post once fully registered. 24 registrants noted the effect of workload or unnecessary bureaucracy on their decision. 10 respondents referred to bullying from colleagues or leadership had led to their choice.
Data previously gathered in 2024-25 where ‘other reasons’ were cited as the reason for leaving the Register indicated the most common reasons as lack of support, lack of job opportunities, the effect of workload or unnecessary bureaucracy, pupil behaviour, and bullying from colleagues or leadership.
Data previously gathered in 2023-24 where ‘other reasons’ were cited as the reason for leaving the Register indicated the most common reasons as lack of job opportunities, lack of support, the effect of workload or unnecessary bureaucracy, pupil behaviour, and bullying from colleagues or leadership.
Registration Status
{{fs-regreport26-table28="/section-components"}}
<span id="es-chart-01" class="table_caption" style="text-align:center; margin: auto; display: block; padding-top: 3.5rem;" fs-test-element="reg-report-title-es-chart-01">Chart 11: Registration Status at time of leaving</span>
95% of respondents (522 including those who selected both Full Registration and Full and Provisional Registration options) held Full Registration in at least one category.
Registration Category
Respondents were asked to select the registration categories in which they held registration; these are reported in Table 29. As with all questions in this survey, the results are self-reported and cannot be checked for accuracy due to the anonymous nature of the survey.
{{fs-regreport26-table29="/section-components"}}
Of the 549 respondents, 489 (89%) held registration in one category; 56 (10%) in two categories; and 2 (<1%) in three or four categories.
<span id="es-chart-01" class="table_caption" style="text-align:center; margin: auto; display: block; padding-top: 3.5rem;" fs-test-element="reg-report-title-es-chart-01">Chart 12: Registrations held at time of leaving</span>
Chart 12 shows the total number of registrations (607) held in each category by respondents to the survey. The greatest number of registrations were in Primary Education with Secondary (Subject) Education the next biggest group.
Stage of Career
{{fs-regreport26-table30="/section-components"}}
The largest group were those who had held Full Registration for 5 or more years. 24 individuals (4%) lapsed before gaining Full Registration.
Table 26, under the ‘Leaving the Register – Overview’ section, gives information about all registrants who have left or been removed from the Register (and have not returned) since 1 January 2019, following completion of an induction period and within 5 years of gaining Provisional Registration. This data shows that since January 2021 an increasing number of these teachers have left the Register and have not returned.
Sex
{{fs-regreport26-table31="/section-components"}}
<span id="es-chart-01" class="table_caption" style="text-align:center; margin: auto; display: block; padding-top: 3.5rem;" fs-test-element="reg-report-title-es-chart-01">Chart 13: Sex</span>
79% of registrants who left the Register were female. The remaining 21% were male. 4 respondents chose to skip this question. On the Register as a whole, 77% of registrants are female and 22% of registrants are male. On the Scottish Government teacher census 2025, 77% of teachers are female.
Age at time of leaving
{{fs-regreport26-table32="/section-components"}}
<span id="es-chart-01" class="table_caption" style="text-align:center; margin: auto; display: block; padding-top: 3.5rem;" fs-test-element="reg-report-title-es-chart-01">Chart 14: Age at time of leaving</span>
74% of respondents were over the age of 55 when they left the Register. Chart 14 shows the percentage in each age group compared to the Register as a whole and the Scottish Government teacher census 2025.
Gender/Gender reassignment
When asked if they consider themselves to be trans or have a trans history, 547 of respondents stated ‘No’ and 2 respondents selected ‘Yes’. For those who selected ‘Yes’, when asked to describe their trans status, one answered ‘non-binary’ whereas the other answered ‘trans woman’.
Ethnicity
{{fs-regreport26-table33="/section-components"}}
Table 33 shows that the majority of respondents have an ethnicity of ‘White – Scottish’ (80%). 8 respondents chose to skip the Ethnicity section.
Nationality
{{fs-regreport26-table34="/section-components"}}
Table 34 shows that the majority of respondents were British (92%).
43 respondents chose ‘Other’ as their nationality. 28 of the 43 respondents chose to write their nationality.
{{fs-regreport26-table35="/section-components"}}
Religion
{{fs-regreport26-table36="/section-components"}}
Table 36 shows that 42% of respondents do not have a religion. 29% of respondents selected Church of Scotland and 18% chose Roman Catholic as their answer. Eight respondents chose to skip the Religion section.
The number of respondents who selected Other Christian as their answer was 48. Of those, 44 respondents chose to provide more information. Church of England and Christian were mentioned 9 and 8 times respectively. Baptist was given as an answer 4 times.
Five respondents chose Another religion or body. Humanist was mentioned twice, whereas Brahma Kumaris, Episcopal and Personal beliefs were provided as answers too.
Sexual Orientation
{{fs-regreport26-table37="/section-components"}}
Table 37 shows that most respondents (502, 95%) have a sexual orientation of straight/heterosexual. Twelve (2%) respondents are bisexual, and 10 (2%) others are gay or lesbian. Finally, 5 individuals responded that they have another sexual orientation. Asexual, Pansexual and Queer were all provided as answers.
Disability/Health
{{fs-regreport26-table38="/section-components"}}
Table 38 shows that the majority (386, 73%) of respondents have no condition or disability that affects their health. Respondents with a long-term illness, disease or condition (one that they may have for life, which may be managed with treatment or medication) make up 9% of the responses.
Caring Responsibilities
{{fs-regreport26-table39="/section-components"}}
Table 39 shows that the majority of respondents do not have caring responsibilities in their personal lives. Of the respondents that have one type of caring responsibility, 55 (10%) have a responsibility as a carer or assistant for an older person or people (65 years and over), whereas 46 (9%) respondents have a responsibility as a carer of a child or children (under 18 years). Furthermore, 10 (2%) individuals are the carer or assistant for a disabled adult (18 years and over).
Harassment
{{fs-regreport26-table40="/section-components"}}
Table 40 reveals that 93 respondents (17%) experienced harassment in their work as a teacher in the last 12 months before leaving the Register.
{{fs-regreport26-table41="/section-components"}}
Table 41 shows that of the 93 respondents who experienced harassment in their work as a teacher in the last 12 months before leaving the Register, 40 (93%) mentioned it was received from colleagues whereas 24 (26%) respondents stated the source was learners.
Combined data
Tables 42a and 42b show the breakdown of reason for leaving by age group. Percentages in table 43a use the total number of respondents in that age group as the denominator e.g. the percentage shown in 42a for the registrants aged 18-24 who indicated that they left the Register because they are leaving or have left Scotland uses the total number of respondents in the age category 18-24 as the denominator. Percentages in table 42b use the total number of respondents across all age groups who gave that reason for leaving as the denominator. For example, in table 42a below, 1 individual aged 18-24 said that they taking a career break. 17% of all 18-24 year-olds gave this as their reason for leaving the Register. Table 42b shows that 31% of everyone (of all ages) who gave ‘I am leaving or have left Scotland’ as a reason for leaving the Register were aged 25-34.
{{fs-regreport26-table42a="/section-components"}}
{{fs-regreport26-table42b="/section-components"}}
Tables 43a and 43b show the breakdown of reason for leaving by stage of career. Percentages in table 43a the total number of respondents in that career stage, as the denominator. For example, the percentage shown in table 43a for the registrants by stage of career who indicated that they left the Register because they are leaving or have left Scotland uses the total number of respondents in that stage of career as the denominator. Percentages in table 43b use the total number of respondents who gave that reason for leaving across all career stages, as the denominator (see example in Table 42 for further explanation if required).
{{fs-regreport26-table43a="/section-components"}}
{{fs-regreport26-table43b="/section-components"}}
The most common reason for leaving the Register for registrants who were fully registered for 5 or more years was retirement (71%) with 99% of all those leaving due to retirement being in this career stage.
For those in the early career stage, the most common reason for leaving the Register was leaving the profession for other reasons (53%) with the second most common reason being that they were leaving or had already left Scotland (28%). Of the 21 respondents in the early career group who selected ‘other reasons’, 11 (52% of this group) mentioned difficulties securing a post, 4 attributed it to stress (19% of this group) and 3 cited workload (14% of this group).
There were similar reported results for those who left the Register who were provisionally registered with 67% of these respondents leaving the profession for other reasons and with a further 17% leaving due to leaving or having left Scotland. ‘Other reasons’ in this group (16 respondents) cited lack of support (6; 38%) and difficulty securing a post (8; 50%). 3 respondents in this group (19%) also cited bullying as a factor.
It should be noted that respondents could give several ‘other’ reasons for leaving the Register and so multiple factors may be attributed to each individual.

End of document
"
"
"
"
"
"


9
/
10