Information about our registrants
When an individual is on our Register they are called a registrant.
Registrants and registrations
Table 2 shows the total number of registrants along with the number of registrations held by them. There are more registrations than registrants as some registrants are registered in more than one category of registration.
{{fs-regreport-table2="/section-components"}}
We can see from the above data that both the total number of registrants and the total number of registrations have been relatively stable over the 2024-25 registration year. Of potential interest is that the number of registrations continues to decrease at a higher rate than the decrease in the number of registrants. This has led us to question the number of registrations held by individuals leaving our Register through the Leaving the Register of Teachers survey and to explore how many registrations are held by individuals on the Register.
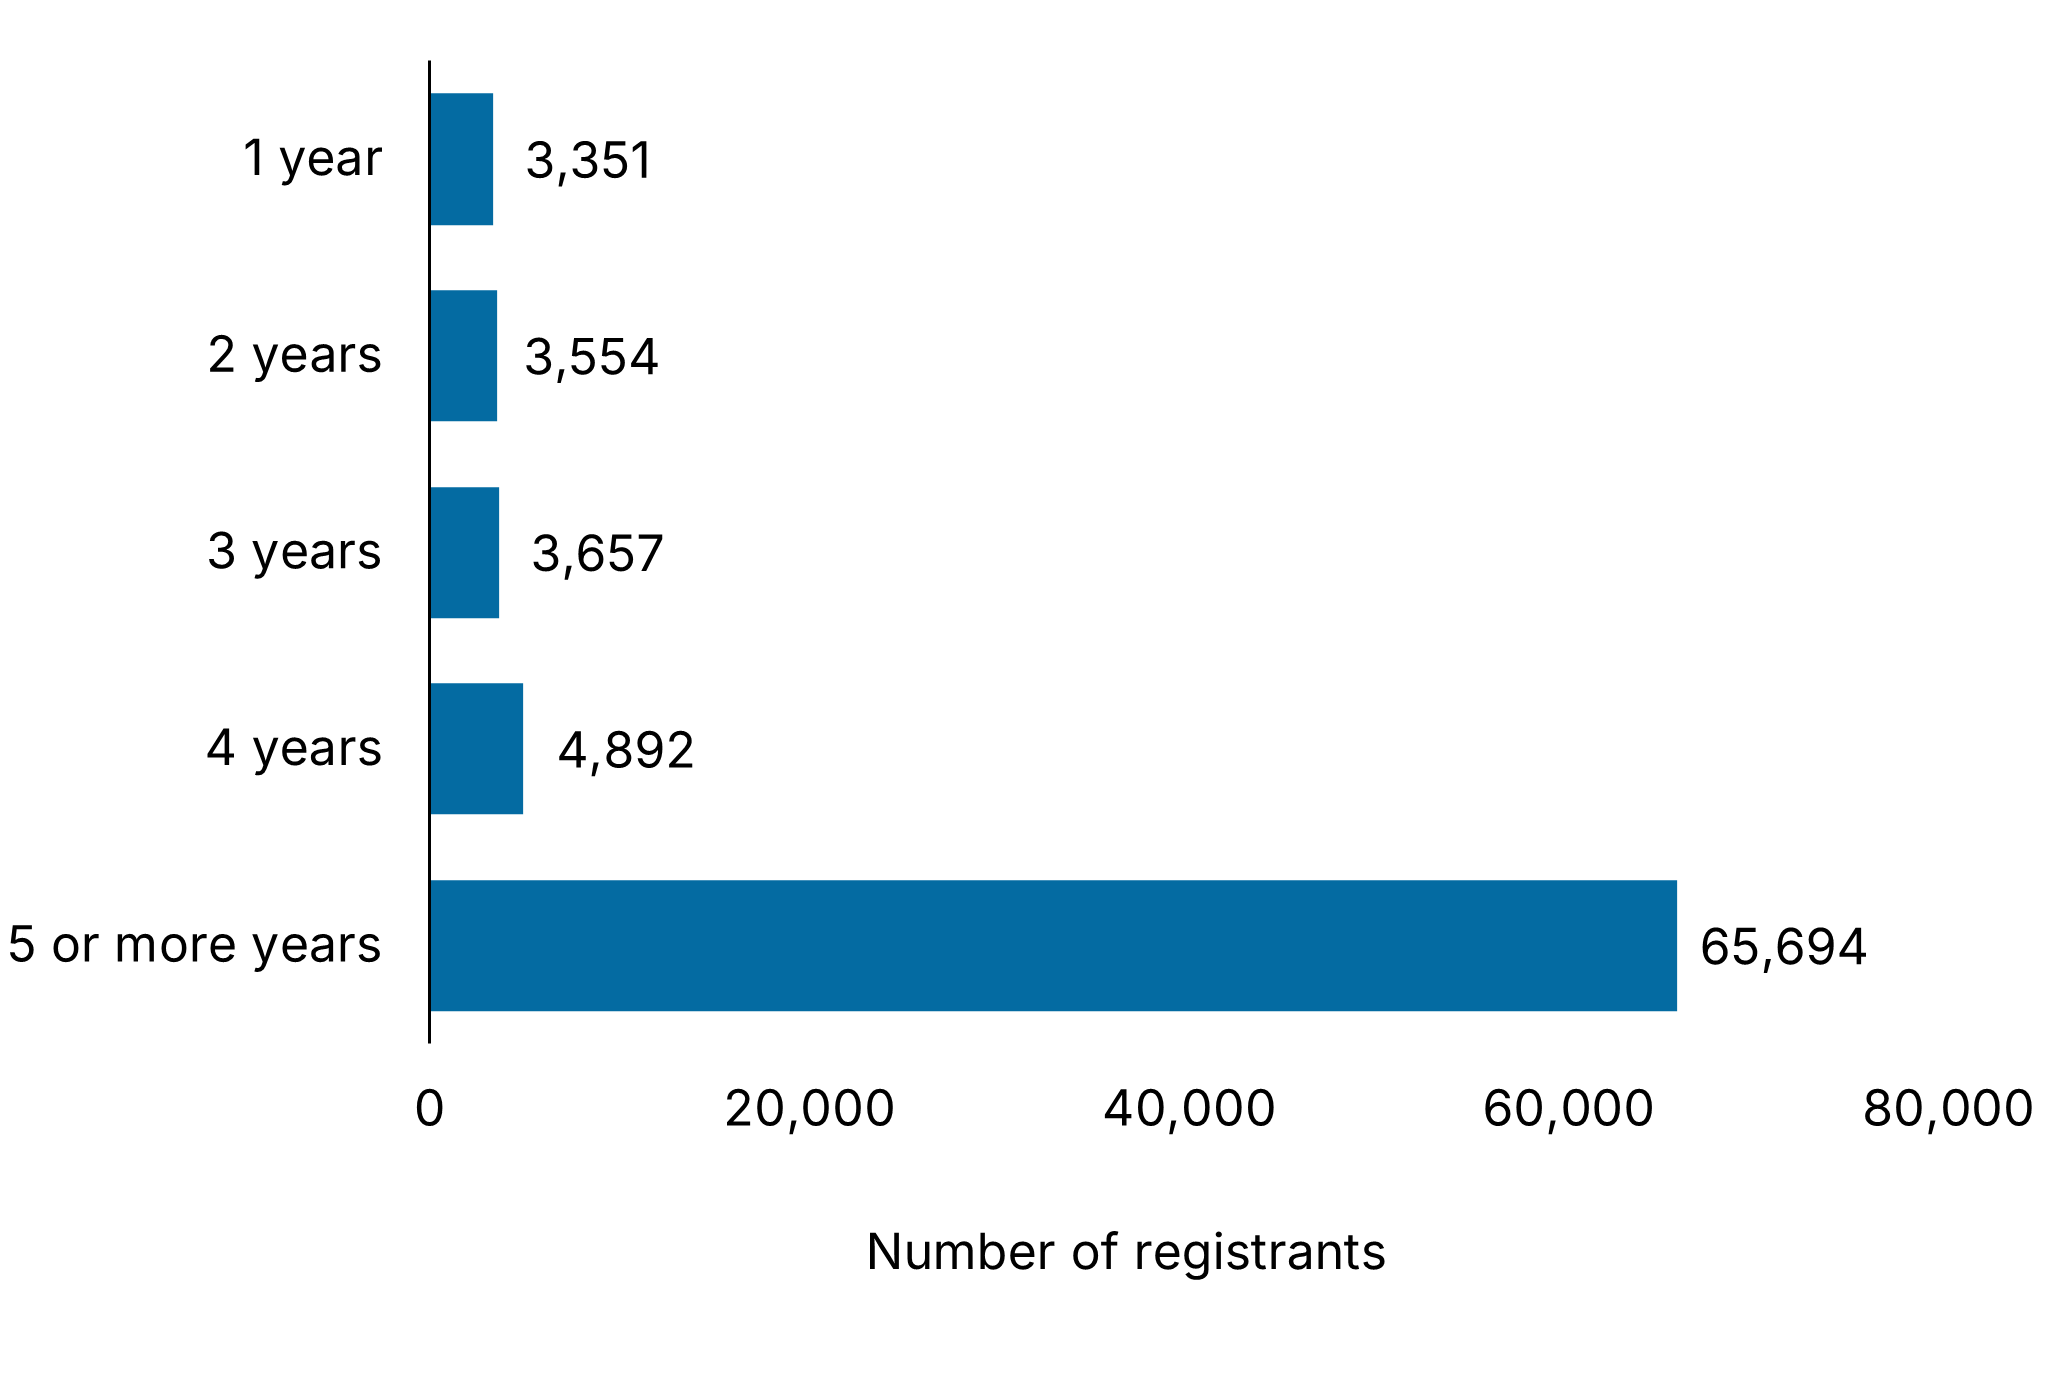
Data at 31 March 2025 (Chart 1) shows that that vast majority (80.96%) of registrants have been registered with GTC Scotland for 5 or more years:
• 3,351 registrants have been registered for 1 year (4.13% of all registrants)
• 3,554 registrants have been registered for 2 years (4.38% of all registrants)
• 3,657 registrants have been registered for 3 years (4.51% of all registrants)
• 4,892 registrants have been registered for 4 years (6.03% of all registrants)
• 65,694 registrants have been registered for 5 or more years (80.96% of all registrants)
<span id="es-chart-01" class="table_caption" style="text-align:center; margin: auto; display: block; padding-top: 3.5rem;" fs-test-element="reg-report-title-es-chart-01">Chart 1: Number of registrants by years registered</span>
Data at 31 March 2025 (Chart 2) shows that 70,773 registrants hold one registration (87.21% of registrations) and 10,375 registrants hold multiple registrations (12.79%).
Broken down further, we can see that:
- 70,773 registrants hold 1 registration (87.21% of registrations).
- 8,926 registrants hold 2 registrations (11.00% of registrations).
- 1,267 registrants hold 3 registrations (1.56% of registrations).
- 182 registrants hold 4 or more registrations (0.22% of registrations).
<span id="es-chart-01" class="table_caption" style="text-align:center; margin: auto; display: block; padding-top: 3.5rem;" fs-test-element="reg-report-title-es-chart-01">Chart 2: Number of registrants by number of registrations</span>

Table 3 shows the number of registrants who hold registration in each of the registration categories.
{{fs-regreport-table3="/section-components"}}
*historical registration categories that are valid but no longer in active use
GTC Scotland has 4 statuses of registration:
- Provisional Registration
- Provisional (Conditional) Registration
- Full Registration (General)
- Full Registration (Associate)
Table 4 shows the number of individual registrants, broken down by registration status. The numbers of individual registrants with Provisional Registration and Provisional (Conditional) Registration are included together in the provisionally registered row.
Over the 2024-25 registration year, 2,891 registrants transitioned from being provisionally registered to holding Full Registration (General) status (3,045 in 2023-24).
{{fs-regreport-table4="/section-components"}}
From 31 March 2024 to 31 March 2025, there was a:
- 0.53% decrease in fully registered registrants (Full (General) Registration)
- 0.16% increase in provisionally registered registrants
- 13.62% decrease in fully registered (Associate) registrants.
From 31 March 2023 to 31 March 2025, there was a:
- 0.14% decrease in fully registered registrants (Full (General) Registration)
- 4.53% decrease in provisionally registered registrants
- 21.22% decrease in fully registered (Associate) registrants.
Registrant sex and age
We ask registrants for specific information in relation to their sex and also hold information in relation to the age of registrants. Registrants provide this information and so the statistics we hold are based on the information we receive from them.
Table 5 shows the self-declared sex of registrants with Chart 3, Chart 4 and Chart 5 showing this as a percentage of total registrants.
{{fs-regreport-table5="/section-components"}}
<span id="es-chart-01" class="table_caption" style="text-align:center; margin: auto; display: block; padding-top: 3.5rem;" fs-test-element="reg-report-title-es-chart-01">Chart 3: Registrant self-declared sex at 31 March 2023 – all registrants</span>

<span id="es-chart-01" class="table_caption" style="text-align:center; margin: auto; display: block; padding-top: 3.5rem;" fs-test-element="reg-report-title-es-chart-01">Chart 4: Registrant self-declared sex at 31 March 2024– all registrants</span>

<span id="es-chart-01" class="table_caption" style="text-align:center; margin: auto; display: block; padding-top: 3.5rem;" fs-test-element="reg-report-title-es-chart-01">Chart 5: Registrant self-declared sex at 31 March 2025– all registrants</span>
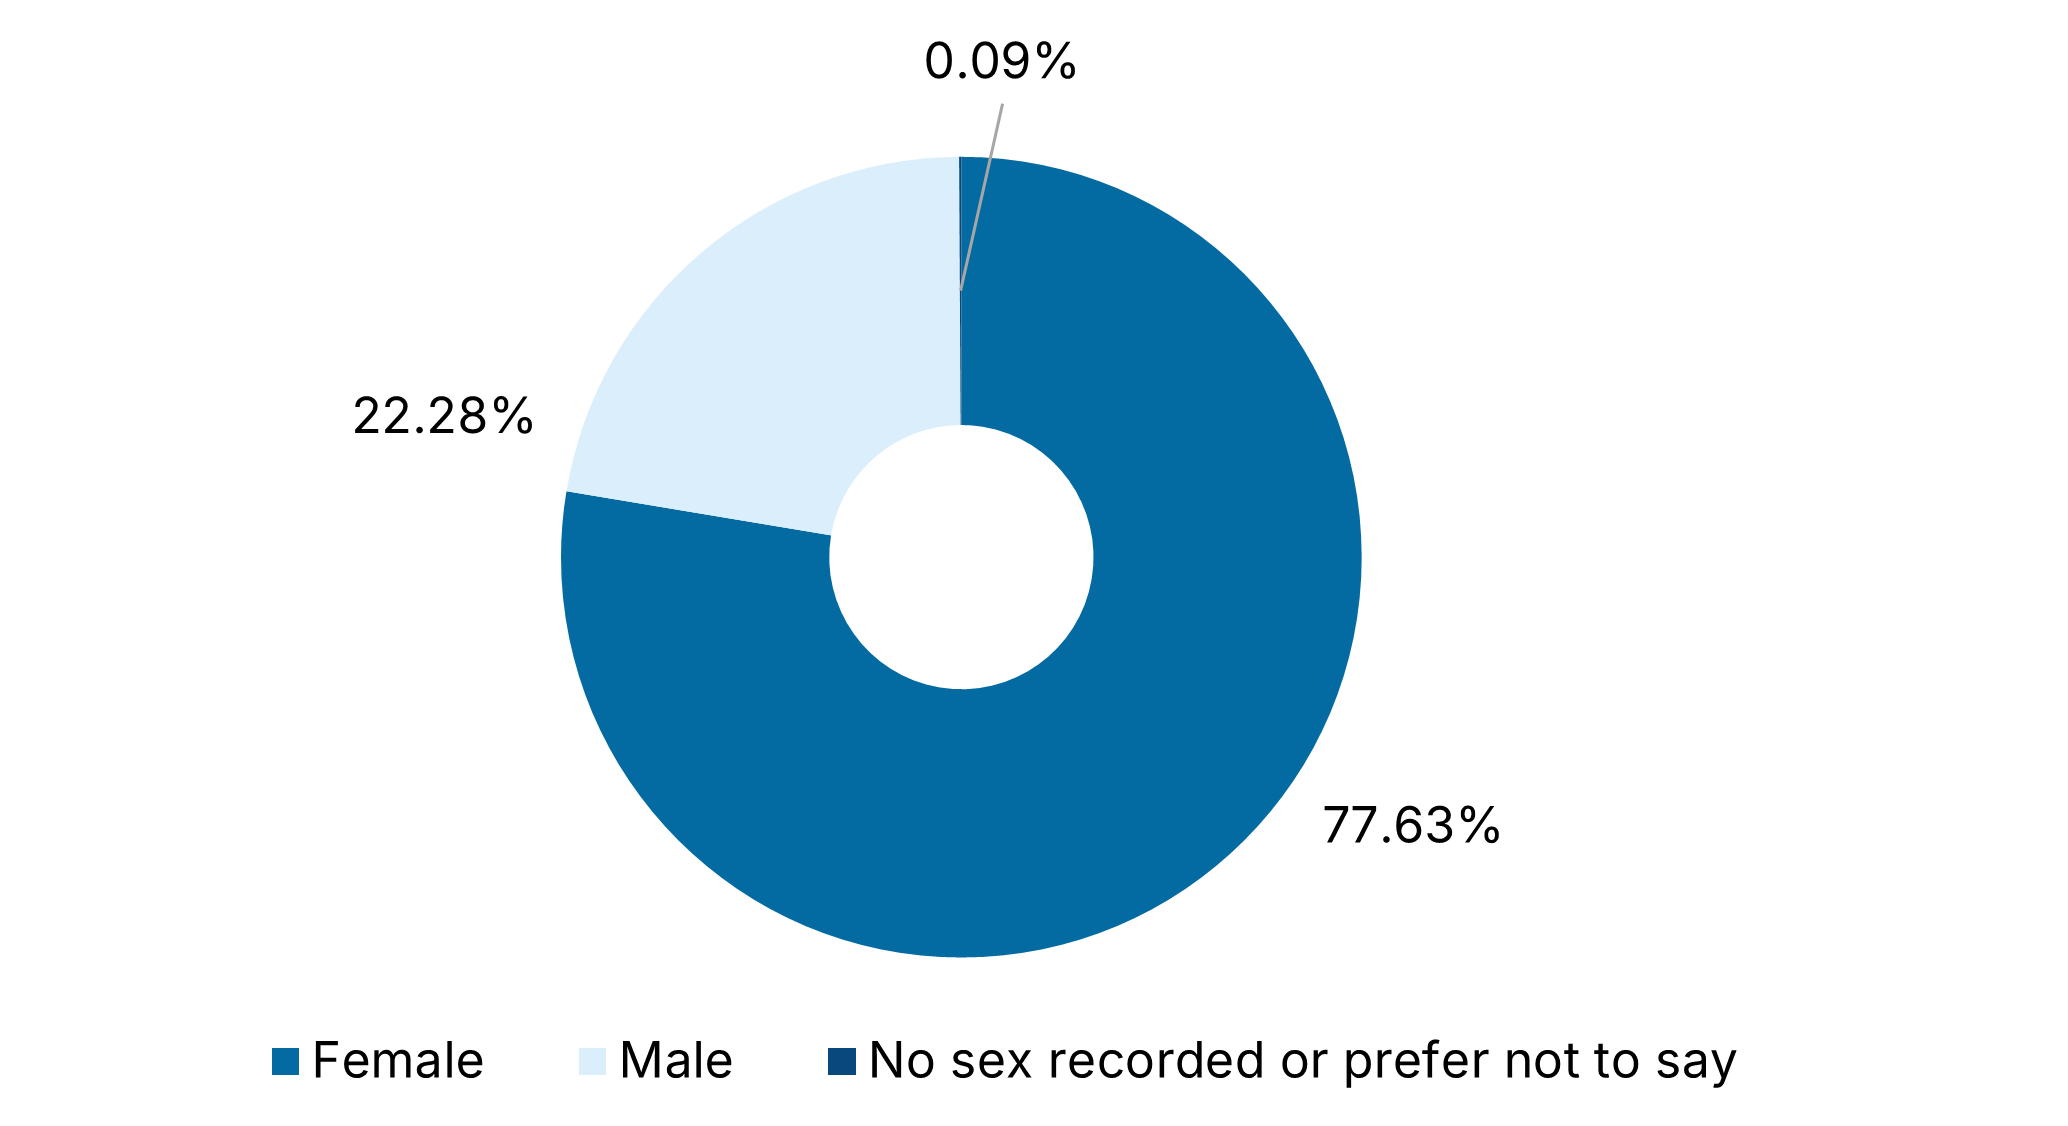
From the self-declared sex of registrants, we can see that the composition of our Register has remained relatively constant over registration year 2024-25 with it being significantly female dominated.
Chart 6 shows the self-declared sex of registrants as a percentage by registration category held as at 31 March 2025. It can be seen from this chart that the difference in the percentage of females compared to males in each registration category varies. In all categories, less than 1% of registrants chose ‘prefer not to say’.
<span id="es-chart-01" class="table_caption" style="text-align:center; margin: auto; display: block; padding-top: 3.5rem;" fs-test-element="reg-report-title-es-chart-01">Chart 6: Registrant self-declared sex at 31 March 2025 by registration category</span>

Table 6 summarises the percentage of registrants in the following age brackets rounded to the nearest percentage and Chart 7 shows the information for 31 March 2025.
{{fs-regreport-table6="/section-components"}}
*(Rounding to the nearest percentage means that these do not total 100%)
<span id="es-chart-01" class="table_caption" style="text-align:center; margin: auto; display: block; padding-top: 3.5rem;" fs-test-element="reg-report-title-es-chart-01">Chart 7: Percentage of all registrants within each age grouping</span>

The age brackets of registrants show that three fifths of the Register is under 46 years old (60%), over one fifth is between 46 and 55 years old (24%), and almost one fifth is over 55 years old (16%).
Further sex and age information for registrants broken into registration categories held is explored further below.
Table 7 shows self-declared sex and age information for Primary Education, Table 8 for Secondary (Subject) Education, Table 9 for Additional Support Needs and Table 10 for Further Education.
{{fs-regreport-table7="/section-components"}}
{{fs-regreport-table8="/section-components"}}
{{fs-regreport-table9="/section-components"}}
{{fs-regreport-table10="/section-components"}}
These tables show the average (and median) ages of teachers registered in the category of Primary Education and/or Secondary (Subject) Education being very similar. Almost all averages for these categories fall within the 41-45 age bracket.
The average (and median) ages of teachers registered in the category of Further Education and Additional Support Needs show that the average age is older for registrants in these categories. Average ages for Additional Support Needs fall within the 46-50 age bracket with average ages for Further Education mostly falling within the 51-55 age bracket.
Gaelic registration and Gaelic Medium Education
As at 4 September 2025, 362 registrants can deliver lessons in Gaelic Medium Education (GME). This is self-declared by the applicant when they apply via the Qualified inside Scotland ITE route.
- 132 registrants hold Gaelic registration, of which there are:
- 115 Full Registrations
- 14 Provisional Registrations
- 3 Provisional (Conditional) Registrations
Of the 362 registrants that can deliver lessons in GME, 45 also hold a Gaelic registration (12.43%).
Of the 132 registrants that hold a Gaelic registration, 45 registrants can deliver lessons in GME (34.09%).
As at 19 May 2025, 27 of the 2744 individuals (0.98%) with a TIS placement for academic year 2025-26 declared they can deliver lessons in GME.
Table 11 shows the variation of the Languages – Gaelic registration numbers over the past 3 years (2022-23, 2023-24 and 2024-25).
{{fs-regreport-table11="/section-components"}}
Table 12 shows the number of registrants that are registered only in Gaelic or registered in Gaelic and at least one other registration.
{{fs-regreport-table12="/section-components"}}
Table 13 shows the self-declared sex of registrants that hold Gaelic registration, along with the average and median age.
{{fs-regreport-table13="/section-components"}}
Table 14 shows the number of registrants that hold Gaelic registration by the following age brackets.
{{fs-regreport-table14="/section-components"}}
Employers of registrants
Table 15 shows the number of registrants by employer group. This information is self-declared by registrants as our Register is not an employment-based register.
Registrants under the employer category of ‘Supply’ are those who have not specified an employer. This supply figure does not include registrants who have told us that they are working as a supply teacher and who have shared an employer group with us (e.g. local authority/ies) - this is included elsewhere.
{{fs-regreport-table15="/section-components"}}
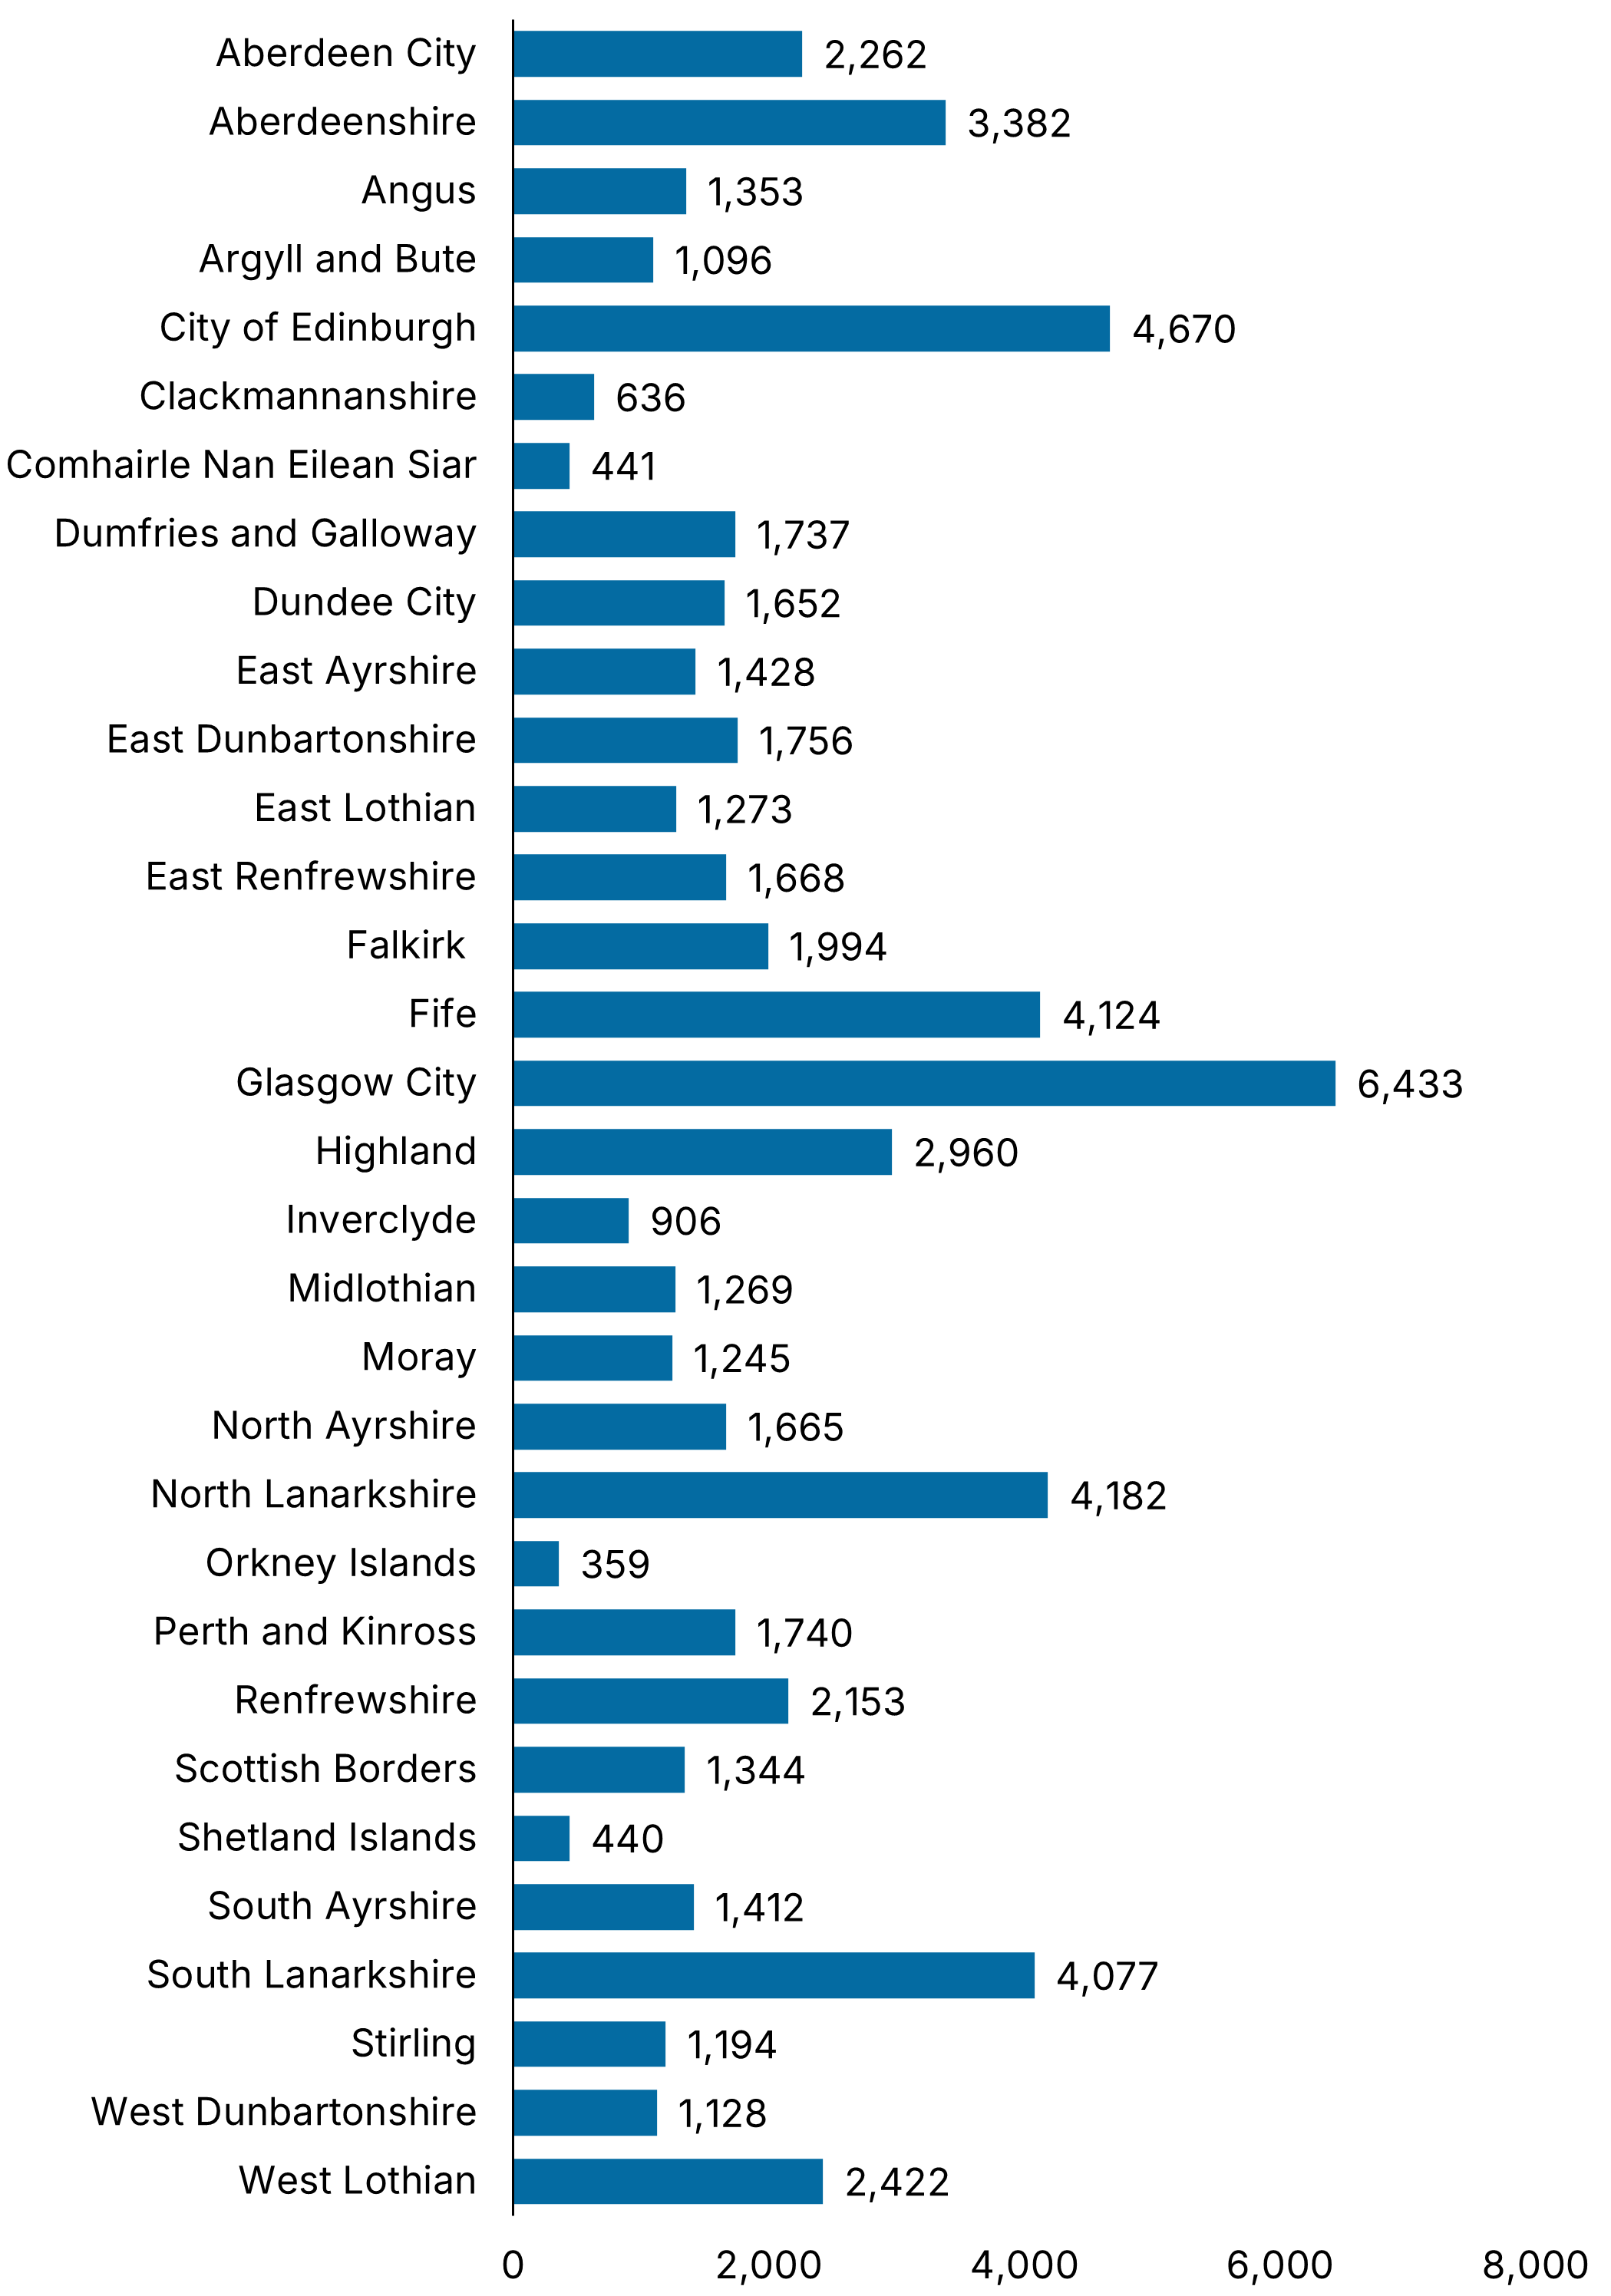
Chart 8 shows the number of registrants per local authority in Scotland. This information is self-declared by registrants.
<span id="es-chart-01" class="table_caption" style="text-align:center; margin: auto; display: block; padding-top: 3.5rem;" fs-test-element="reg-report-title-es-chart-01">Chart 8: Number of registrants by local authority in Scotland (self-declared)</span>
When an individual is on our Register they are called a registrant.
Registrants and registrations
Table 2 shows the total number of registrants along with the number of registrations held by them. There are more registrations than registrants as some registrants are registered in more than one category of registration.
{{fs-regreport-table2="/section-components"}}
We can see from the above data that both the total number of registrants and the total number of registrations have been relatively stable over the 2024-25 registration year. Of potential interest is that the number of registrations continues to decrease at a higher rate than the decrease in the number of registrants. This has led us to question the number of registrations held by individuals leaving our Register through the Leaving the Register of Teachers survey and to explore how many registrations are held by individuals on the Register.
Data at 31 March 2025 (Chart 1) shows that that vast majority (80.96%) of registrants have been registered with GTC Scotland for 5 or more years:
• 3,351 registrants have been registered for 1 year (4.13% of all registrants)
• 3,554 registrants have been registered for 2 years (4.38% of all registrants)
• 3,657 registrants have been registered for 3 years (4.51% of all registrants)
• 4,892 registrants have been registered for 4 years (6.03% of all registrants)
• 65,694 registrants have been registered for 5 or more years (80.96% of all registrants)
<span id="es-chart-01" class="table_caption" style="text-align:center; margin: auto; display: block; padding-top: 3.5rem;" fs-test-element="reg-report-title-es-chart-01">Chart 1: Number of registrants by years registered</span>
Data at 31 March 2025 (Chart 2) shows that 70,773 registrants hold one registration (87.21% of registrations) and 10,375 registrants hold multiple registrations (12.79%).
Broken down further, we can see that:
- 70,773 registrants hold 1 registration (87.21% of registrations).
- 8,926 registrants hold 2 registrations (11.00% of registrations).
- 1,267 registrants hold 3 registrations (1.56% of registrations).
- 182 registrants hold 4 or more registrations (0.22% of registrations).
<span id="es-chart-01" class="table_caption" style="text-align:center; margin: auto; display: block; padding-top: 3.5rem;" fs-test-element="reg-report-title-es-chart-01">Chart 2: Number of registrants by number of registrations</span>
Table 3 shows the number of registrants who hold registration in each of the registration categories.
{{fs-regreport-table3="/section-components"}}
*historical registration categories that are valid but no longer in active use
GTC Scotland has 4 statuses of registration:
- Provisional Registration
- Provisional (Conditional) Registration
- Full Registration (General)
- Full Registration (Associate)
Table 4 shows the number of individual registrants, broken down by registration status. The numbers of individual registrants with Provisional Registration and Provisional (Conditional) Registration are included together in the provisionally registered row.
Over the 2024-25 registration year, 2,891 registrants transitioned from being provisionally registered to holding Full Registration (General) status (3,045 in 2023-24).
{{fs-regreport-table4="/section-components"}}
From 31 March 2024 to 31 March 2025, there was a:
- 0.53% decrease in fully registered registrants (Full (General) Registration)
- 0.16% increase in provisionally registered registrants
- 13.62% decrease in fully registered (Associate) registrants.
From 31 March 2023 to 31 March 2025, there was a:
- 0.14% decrease in fully registered registrants (Full (General) Registration)
- 4.53% decrease in provisionally registered registrants
- 21.22% decrease in fully registered (Associate) registrants.
Registrant sex and age
We ask registrants for specific information in relation to their sex and also hold information in relation to the age of registrants. Registrants provide this information and so the statistics we hold are based on the information we receive from them.
Table 5 shows the self-declared sex of registrants with Chart 3, Chart 4 and Chart 5 showing this as a percentage of total registrants.
{{fs-regreport-table5="/section-components"}}
<span id="es-chart-01" class="table_caption" style="text-align:center; margin: auto; display: block; padding-top: 3.5rem;" fs-test-element="reg-report-title-es-chart-01">Chart 3: Registrant self-declared sex at 31 March 2023 – all registrants</span>
<span id="es-chart-01" class="table_caption" style="text-align:center; margin: auto; display: block; padding-top: 3.5rem;" fs-test-element="reg-report-title-es-chart-01">Chart 4: Registrant self-declared sex at 31 March 2024– all registrants</span>
<span id="es-chart-01" class="table_caption" style="text-align:center; margin: auto; display: block; padding-top: 3.5rem;" fs-test-element="reg-report-title-es-chart-01">Chart 5: Registrant self-declared sex at 31 March 2025– all registrants</span>
From the self-declared sex of registrants, we can see that the composition of our Register has remained relatively constant over registration year 2024-25 with it being significantly female dominated.
Chart 6 shows the self-declared sex of registrants as a percentage by registration category held as at 31 March 2025. It can be seen from this chart that the difference in the percentage of females compared to males in each registration category varies. In all categories, less than 1% of registrants chose ‘prefer not to say’.
<span id="es-chart-01" class="table_caption" style="text-align:center; margin: auto; display: block; padding-top: 3.5rem;" fs-test-element="reg-report-title-es-chart-01">Chart 6: Registrant self-declared sex at 31 March 2025 by registration category</span>
Table 6 summarises the percentage of registrants in the following age brackets rounded to the nearest percentage and Chart 7 shows the information for 31 March 2025.
{{fs-regreport-table6="/section-components"}}
*(Rounding to the nearest percentage means that these do not total 100%)
<span id="es-chart-01" class="table_caption" style="text-align:center; margin: auto; display: block; padding-top: 3.5rem;" fs-test-element="reg-report-title-es-chart-01">Chart 7: Percentage of all registrants within each age grouping</span>
The age brackets of registrants show that three fifths of the Register is under 46 years old (60%), over one fifth is between 46 and 55 years old (24%), and almost one fifth is over 55 years old (16%).
Further sex and age information for registrants broken into registration categories held is explored further below.
Table 7 shows self-declared sex and age information for Primary Education, Table 8 for Secondary (Subject) Education, Table 9 for Additional Support Needs and Table 10 for Further Education.
{{fs-regreport-table7="/section-components"}}
{{fs-regreport-table8="/section-components"}}
{{fs-regreport-table9="/section-components"}}
{{fs-regreport-table10="/section-components"}}
These tables show the average (and median) ages of teachers registered in the category of Primary Education and/or Secondary (Subject) Education being very similar. Almost all averages for these categories fall within the 41-45 age bracket.
The average (and median) ages of teachers registered in the category of Further Education and Additional Support Needs show that the average age is older for registrants in these categories. Average ages for Additional Support Needs fall within the 46-50 age bracket with average ages for Further Education mostly falling within the 51-55 age bracket.
Gaelic registration and Gaelic Medium Education
As at 4 September 2025, 362 registrants can deliver lessons in Gaelic Medium Education (GME). This is self-declared by the applicant when they apply via the Qualified inside Scotland ITE route.
- 132 registrants hold Gaelic registration, of which there are:
- 115 Full Registrations
- 14 Provisional Registrations
- 3 Provisional (Conditional) Registrations
Of the 362 registrants that can deliver lessons in GME, 45 also hold a Gaelic registration (12.43%).
Of the 132 registrants that hold a Gaelic registration, 45 registrants can deliver lessons in GME (34.09%).
As at 19 May 2025, 27 of the 2744 individuals (0.98%) with a TIS placement for academic year 2025-26 declared they can deliver lessons in GME.
Table 11 shows the variation of the Languages – Gaelic registration numbers over the past 3 years (2022-23, 2023-24 and 2024-25).
{{fs-regreport-table11="/section-components"}}
Table 12 shows the number of registrants that are registered only in Gaelic or registered in Gaelic and at least one other registration.
{{fs-regreport-table12="/section-components"}}
Table 13 shows the self-declared sex of registrants that hold Gaelic registration, along with the average and median age.
{{fs-regreport-table13="/section-components"}}
Table 14 shows the number of registrants that hold Gaelic registration by the following age brackets.
{{fs-regreport-table14="/section-components"}}
Employers of registrants
Table 15 shows the number of registrants by employer group. This information is self-declared by registrants as our Register is not an employment-based register.
Registrants under the employer category of ‘Supply’ are those who have not specified an employer. This supply figure does not include registrants who have told us that they are working as a supply teacher and who have shared an employer group with us (e.g. local authority/ies) - this is included elsewhere.
{{fs-regreport-table15="/section-components"}}
Chart 8 shows the number of registrants per local authority in Scotland. This information is self-declared by registrants.
<span id="es-chart-01" class="table_caption" style="text-align:center; margin: auto; display: block; padding-top: 3.5rem;" fs-test-element="reg-report-title-es-chart-01">Chart 8: Number of registrants by local authority in Scotland (self-declared)</span>

End of document
"
"
"
"
"
"
Contents
5
/
10