Direct submissions
Professional Learning
Of the 20 direct submission respondents who answered whether they had had a PRD meeting as part of the PU process, 75% had not. Respondents were then asked which factors prevented their opportunity to discuss their self-evaluation, professional learning and evidence of impact and plan future development needs as part of the PRD process. Answers (n=15) included not working in a school, working outside Scotland, not being in employment, no PRD opportunity offered and working through agencies as a supply teacher.
It is also worth noting that the highest response rate for the different questions about engagement with the Professional Standards for the direct submissions cohort was four. Most of the cohort skipped those questions and this could be indicative of a lack of opportunity to engage although more analysis would be needed to determine if that were indeed the case.
Direct submission respondents were asked how they had recorded their professional learning and the answers are shown in table 9 below (n=17).
{{fs-PU-2324-table-9="/section-components"}}
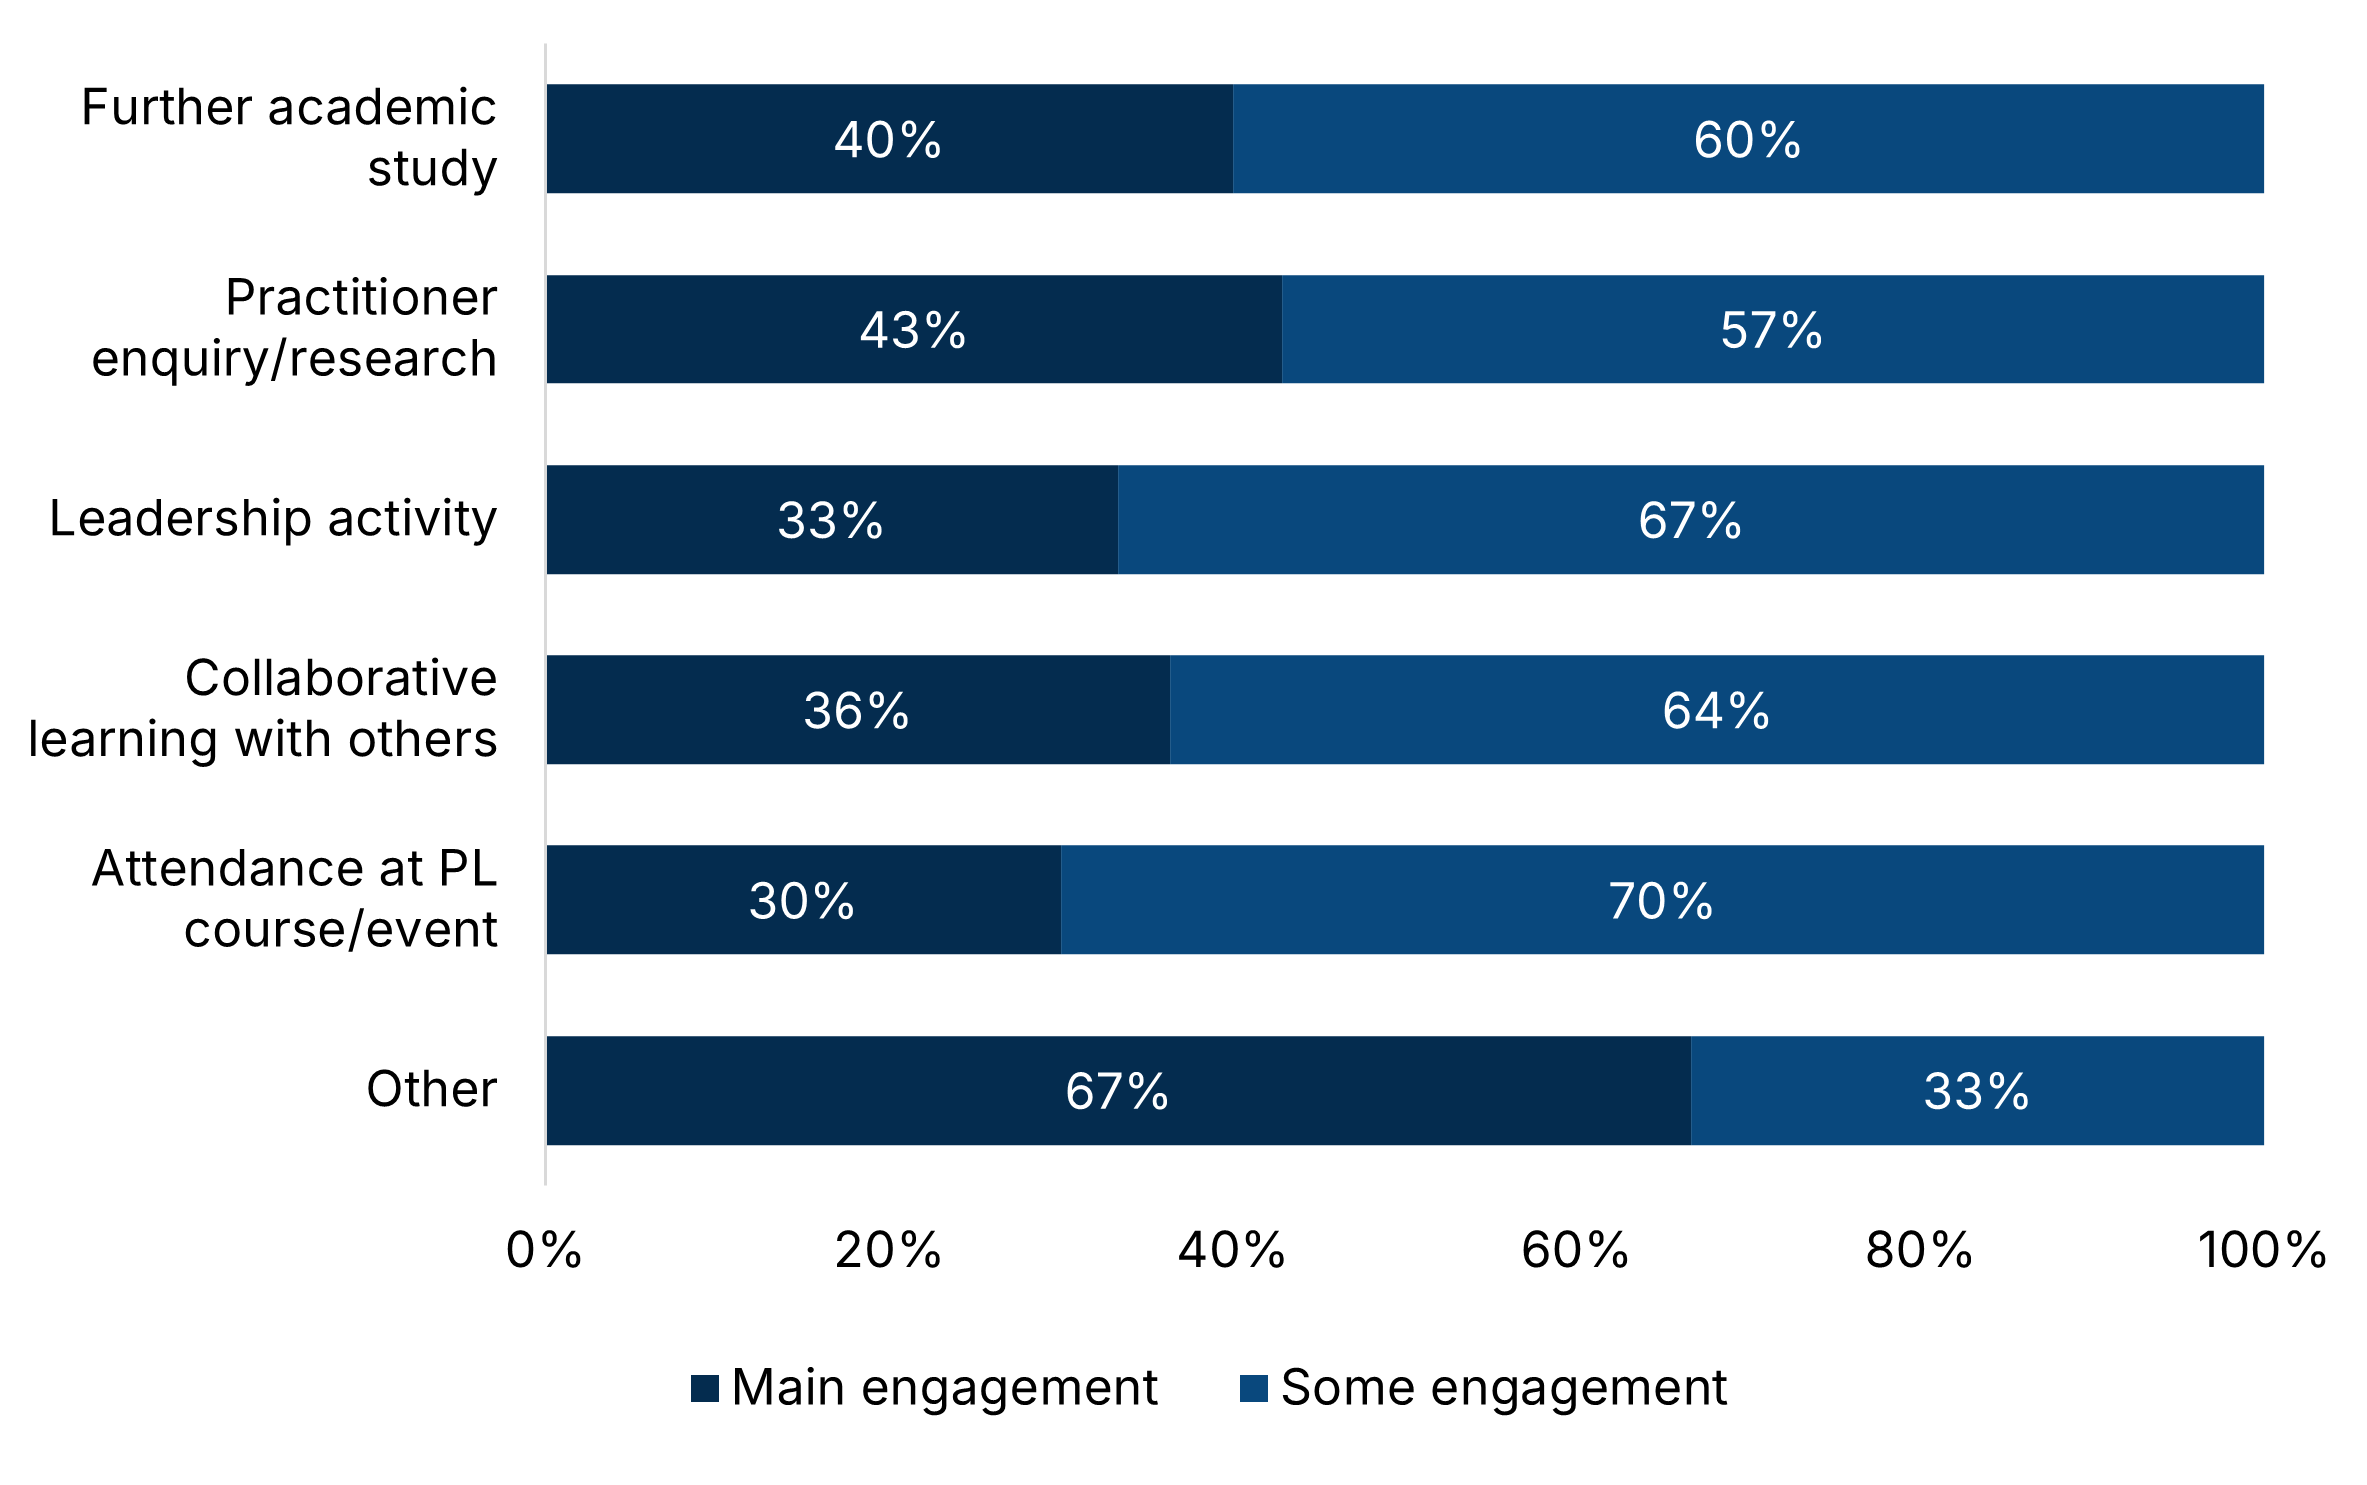
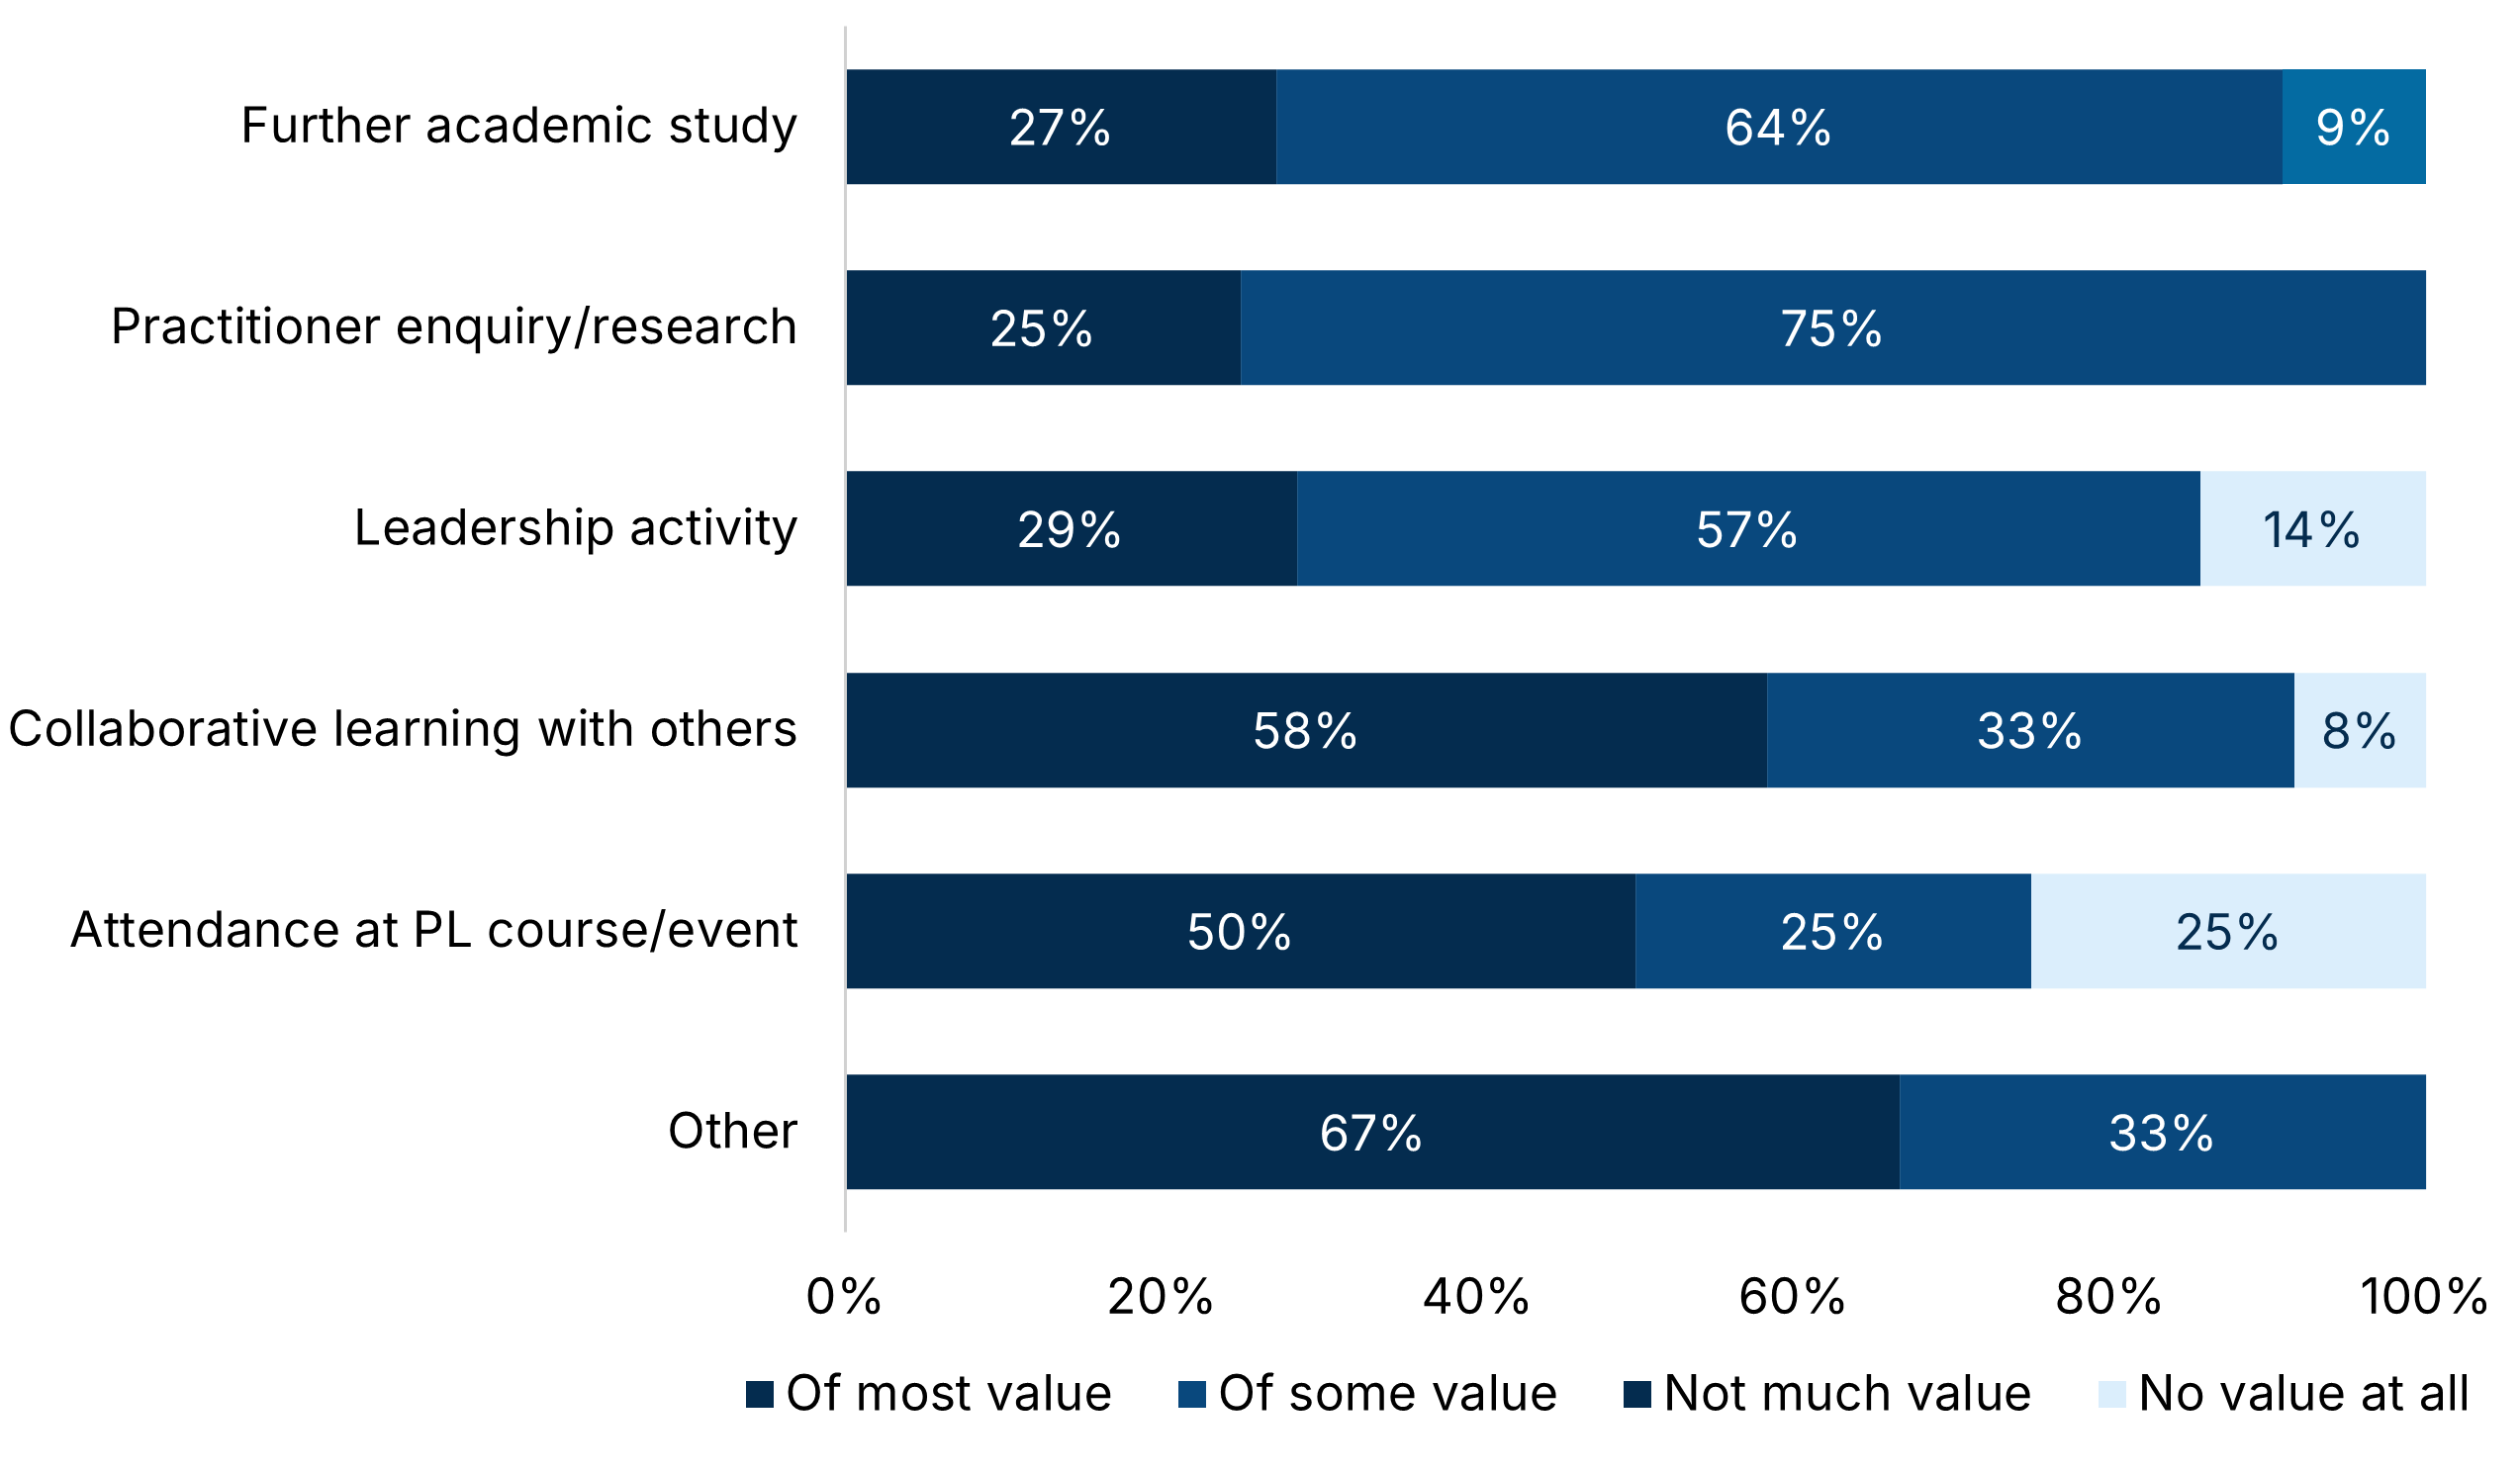
Graph 28 (n=17) indicates the types of professional learning engaged in and it is interesting to note that ‘Collaborative learning with others’ has a 14% lower main engagement rating when compared to the types of professional learning recorded by reviewees from graph 20. This could be a consequence of the sporadic nature of employment for respondents in the direct submissions cohort and, interestingly, 58% of those who had engaged in collaborative learning with others found it was of most value, as shown by graph 29.
<span id="es-chart-01" class="table_caption" style="text-align:center; margin: auto; display: block; padding-top: 3.5rem">Graph 28: Professional learning types</span>
<span id="es-chart-01" class="table_caption" style="text-align:center; margin: auto; display: block; padding-top: 3.5rem">Graph 29: Professional learning value</span>
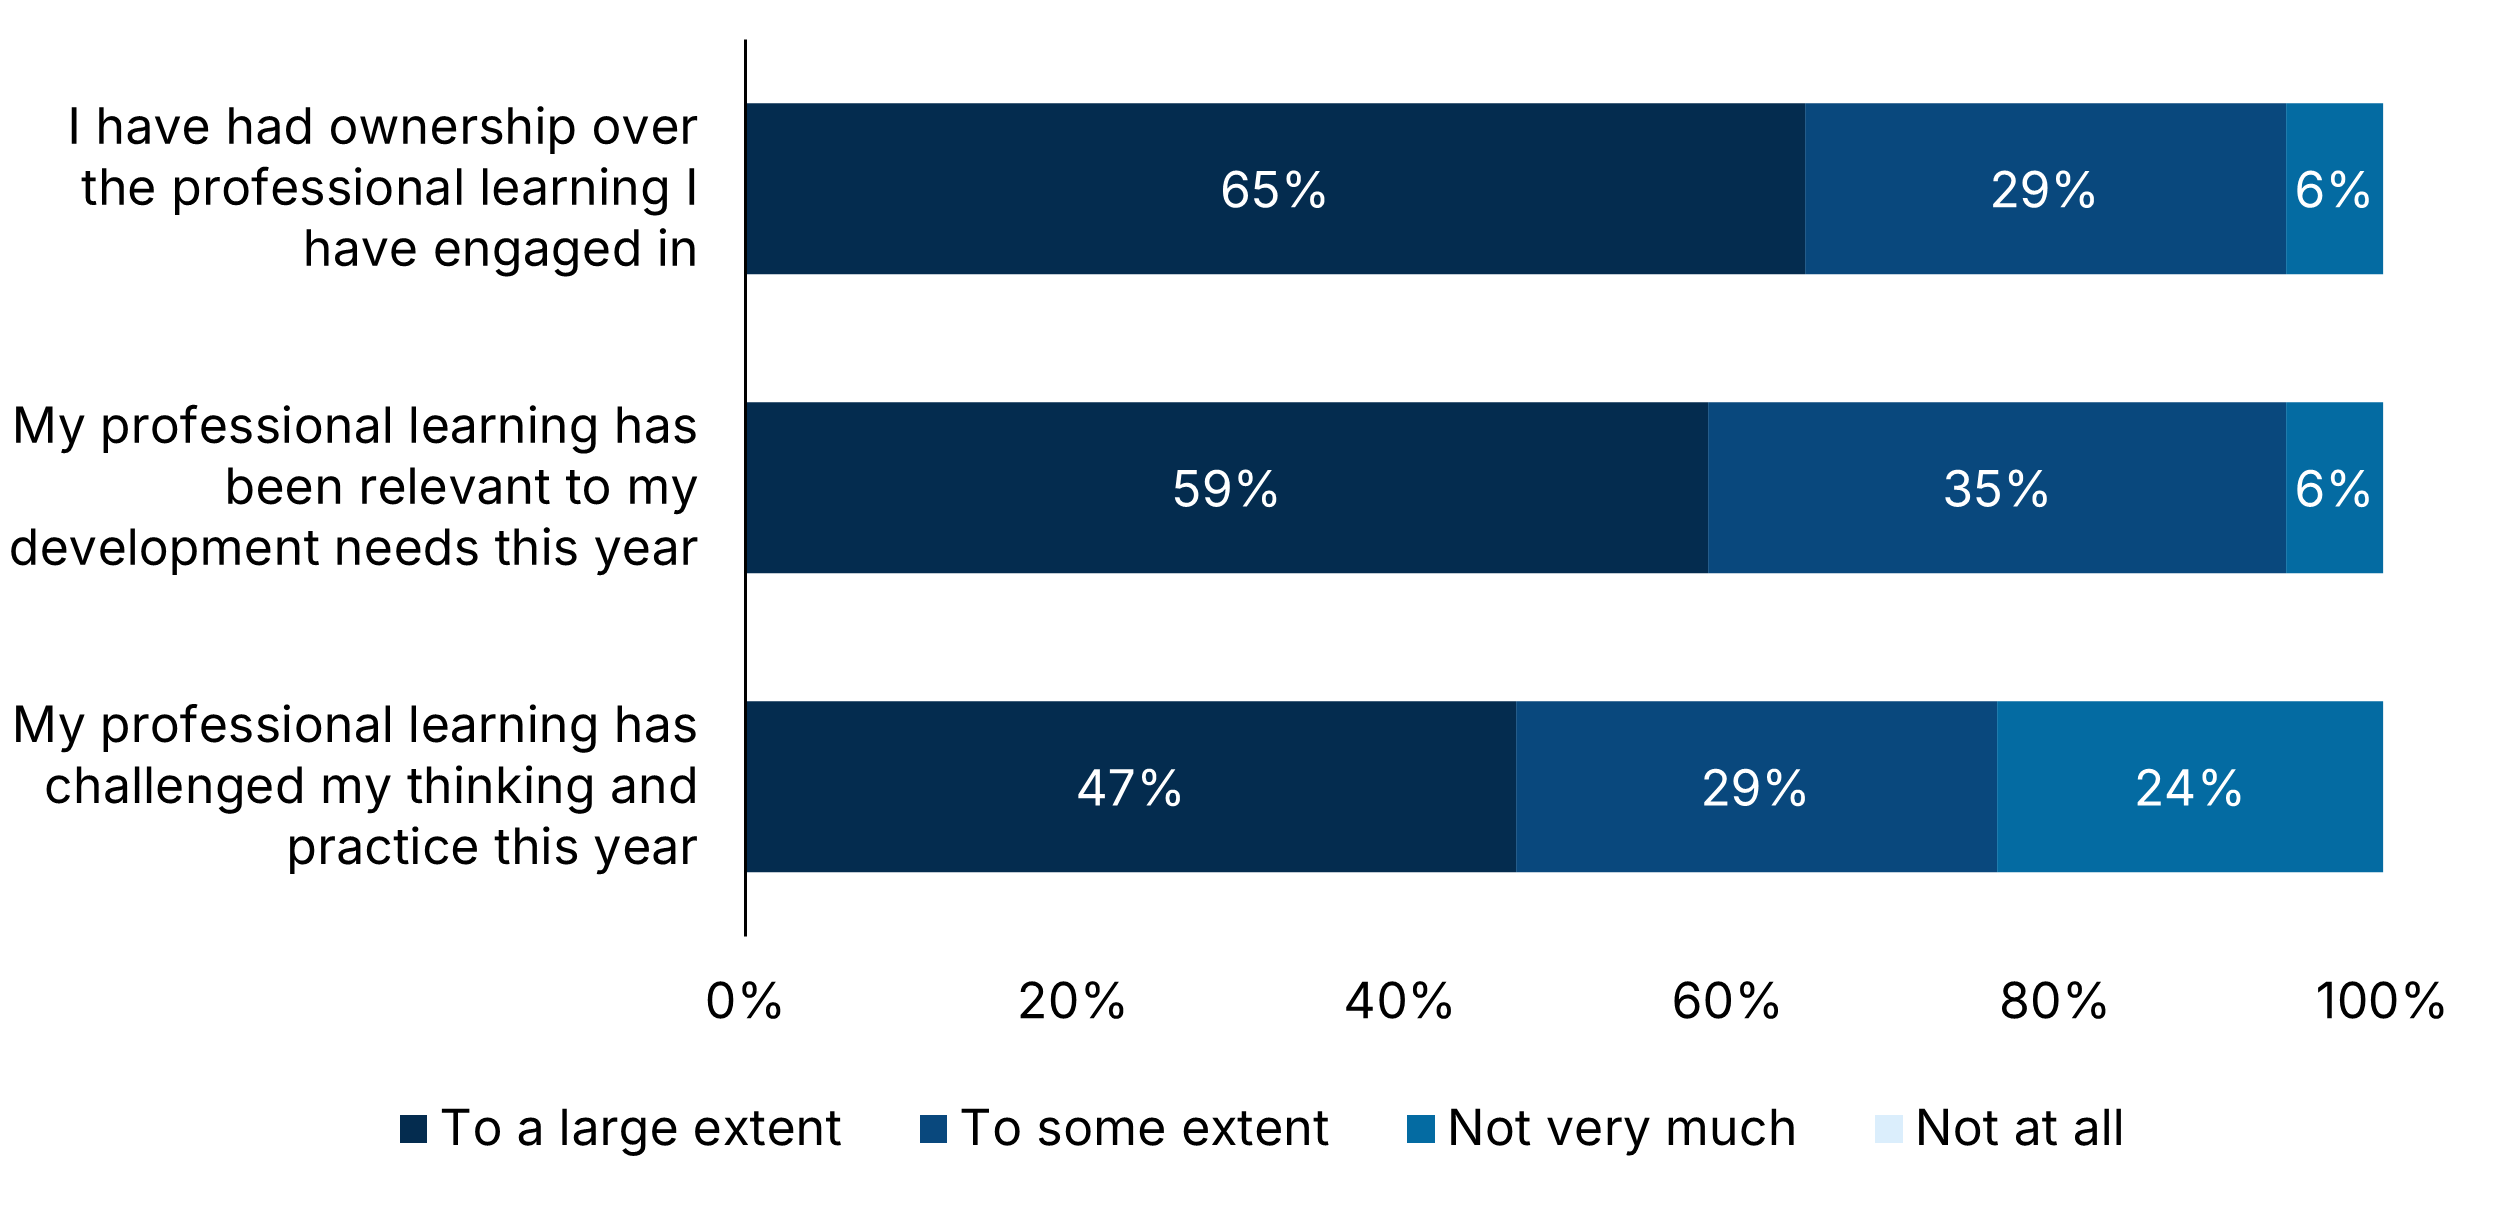
Respondents were asked ‘Thinking about the professional learning you have engaged in this year, please rate the extent of your agreement with the following.’ Results are shown in graph 30 (n=17) and it is striking that 24% did not think their professional learning had challenged their thinking and practice very much. This compares to 15% of reviewees from graph 21 who indicated that their professional learning had not challenged their thinking and practice very much or at all.
<span id="es-chart-01" class="table_caption" style="text-align:center; margin: auto; display: block; padding-top: 3.5rem">Graph 30: Professional learning experience</span>
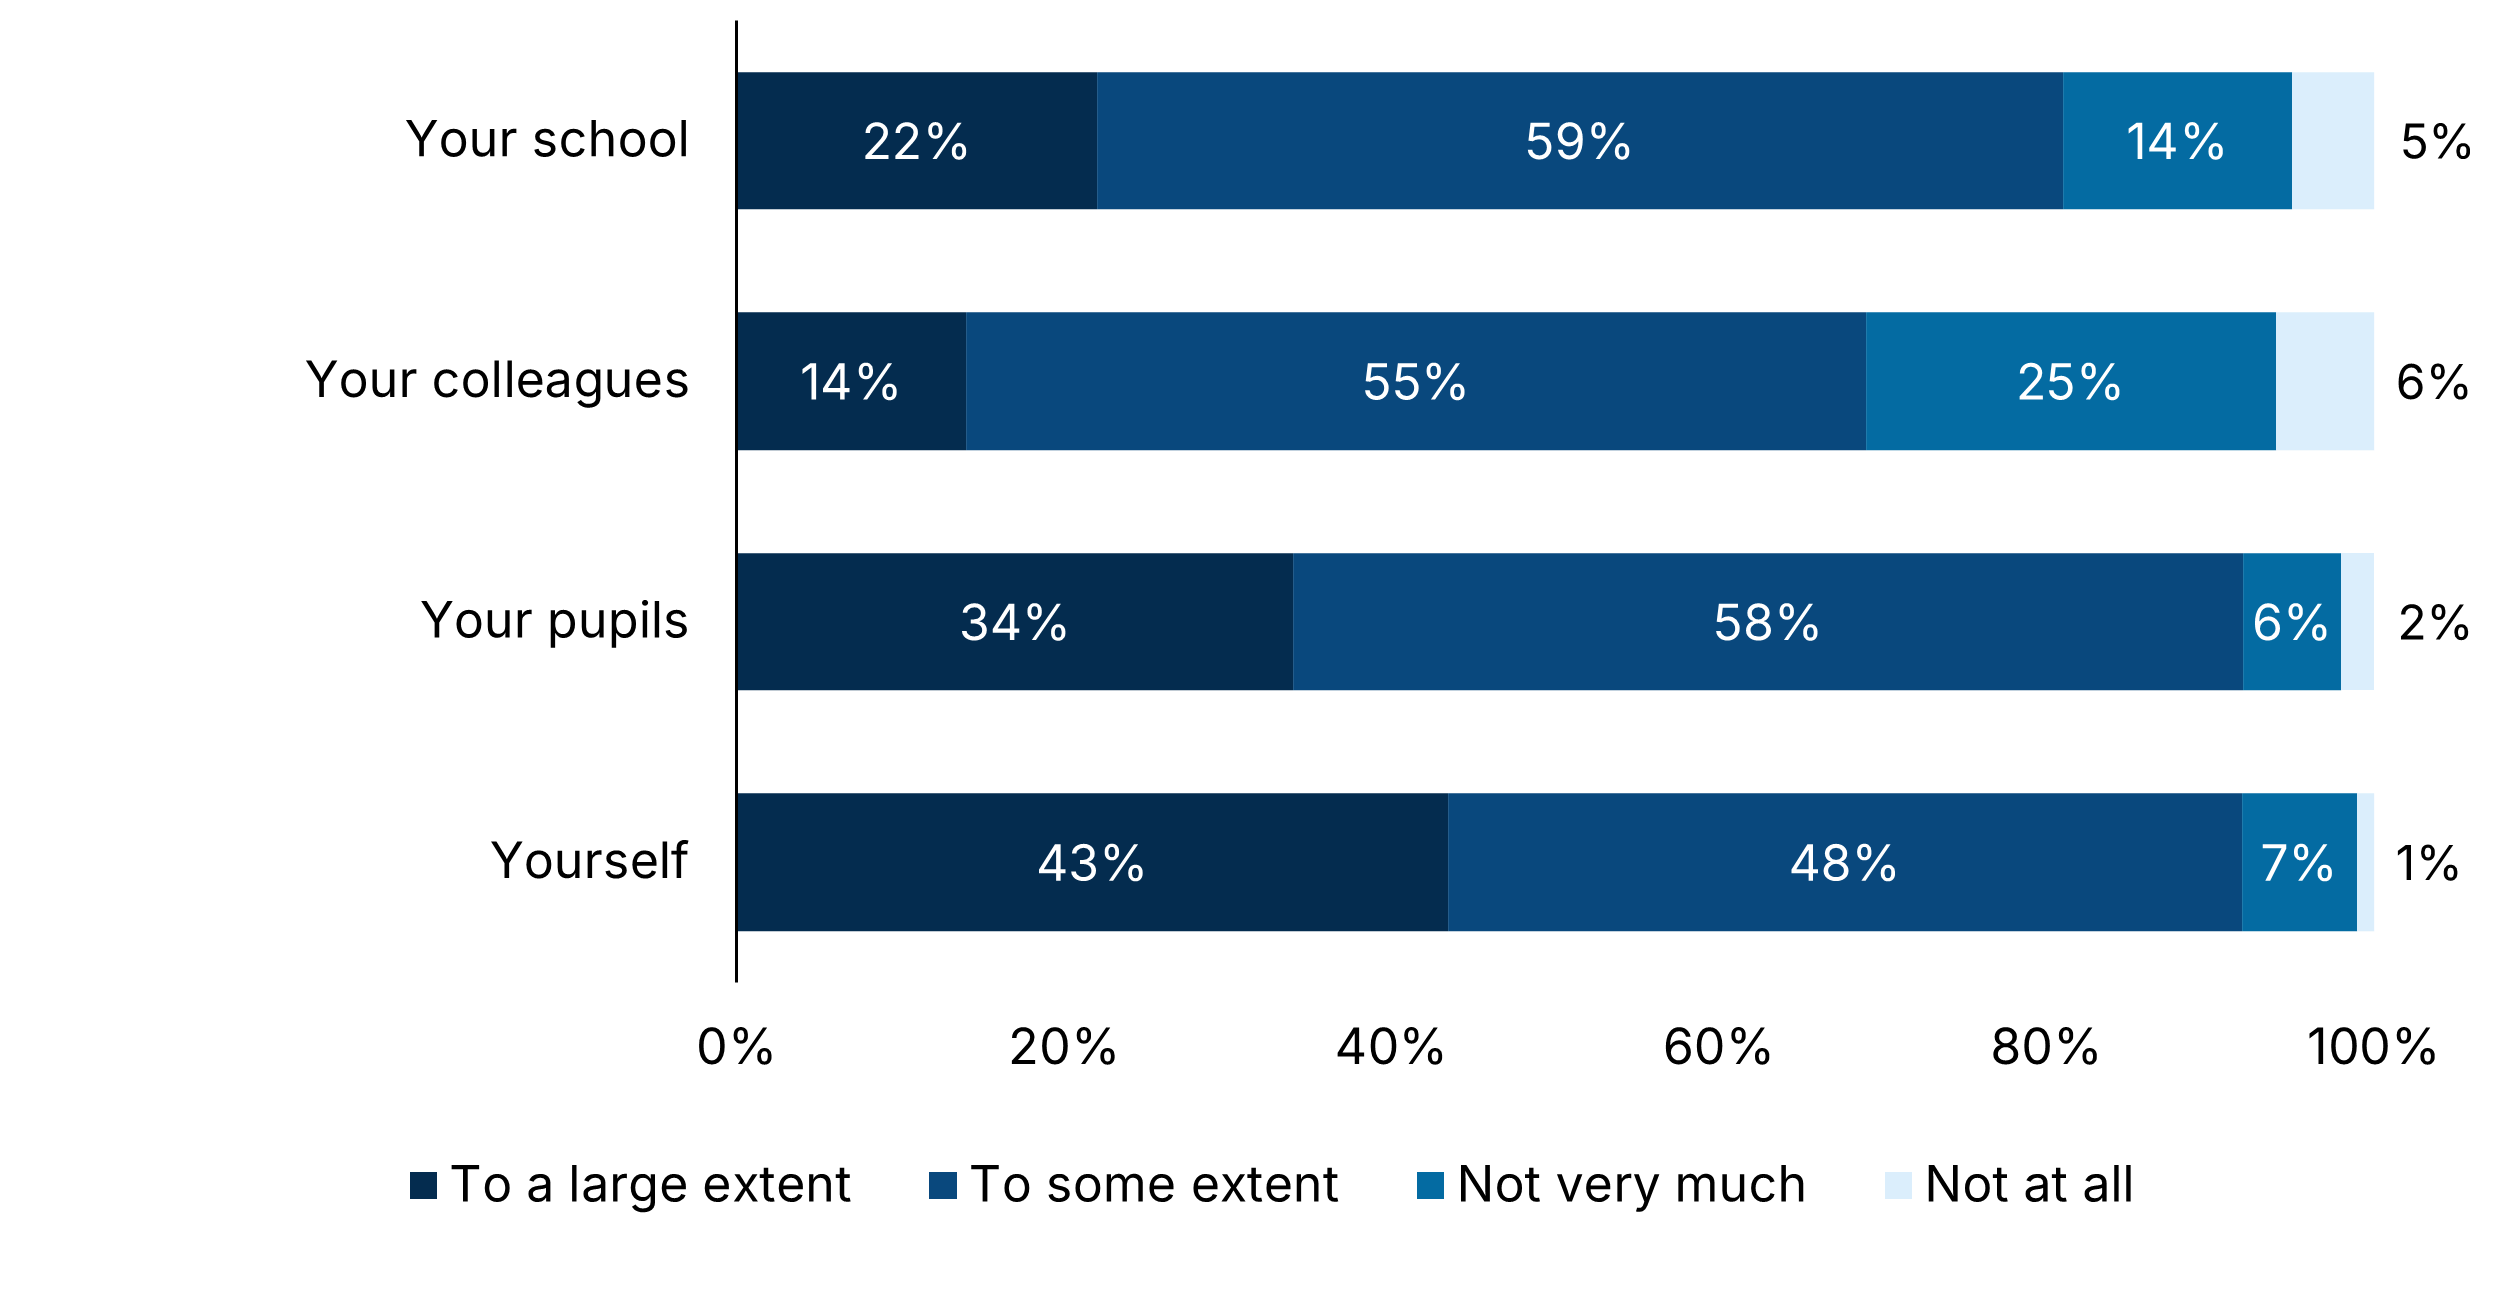
82% of direct submission respondents reported that they had gathered evidence of the impact of their professional learning. When asked ‘To what extent do you think your professional learning has had an impact on yourself, your pupils, your colleagues or your school?’, it is striking that 36% felt their professional learning did not have very much impact or no impact at all on their school. All results for this question are shown in graph 31 (n=17).
<span id="es-chart-01" class="table_caption" style="text-align:center; margin: auto; display: block; padding-top: 3.5rem">Graph 31: Professional learning impact</span>
Professional Learning
Of the 20 direct submission respondents who answered whether they had had a PRD meeting as part of the PU process, 75% had not. Respondents were then asked which factors prevented their opportunity to discuss their self-evaluation, professional learning and evidence of impact and plan future development needs as part of the PRD process. Answers (n=15) included not working in a school, working outside Scotland, not being in employment, no PRD opportunity offered and working through agencies as a supply teacher.
It is also worth noting that the highest response rate for the different questions about engagement with the Professional Standards for the direct submissions cohort was four. Most of the cohort skipped those questions and this could be indicative of a lack of opportunity to engage although more analysis would be needed to determine if that were indeed the case.
Direct submission respondents were asked how they had recorded their professional learning and the answers are shown in table 9 below (n=17).
{{fs-PU-2324-table-9="/section-components"}}
Graph 28 (n=17) indicates the types of professional learning engaged in and it is interesting to note that ‘Collaborative learning with others’ has a 14% lower main engagement rating when compared to the types of professional learning recorded by reviewees from graph 20. This could be a consequence of the sporadic nature of employment for respondents in the direct submissions cohort and, interestingly, 58% of those who had engaged in collaborative learning with others found it was of most value, as shown by graph 29.
<span id="es-chart-01" class="table_caption" style="text-align:center; margin: auto; display: block; padding-top: 3.5rem">Graph 28: Professional learning types</span>
<span id="es-chart-01" class="table_caption" style="text-align:center; margin: auto; display: block; padding-top: 3.5rem">Graph 29: Professional learning value</span>
Respondents were asked ‘Thinking about the professional learning you have engaged in this year, please rate the extent of your agreement with the following.’ Results are shown in graph 30 (n=17) and it is striking that 24% did not think their professional learning had challenged their thinking and practice very much. This compares to 15% of reviewees from graph 21 who indicated that their professional learning had not challenged their thinking and practice very much or at all.
<span id="es-chart-01" class="table_caption" style="text-align:center; margin: auto; display: block; padding-top: 3.5rem">Graph 30: Professional learning experience</span>
82% of direct submission respondents reported that they had gathered evidence of the impact of their professional learning. When asked ‘To what extent do you think your professional learning has had an impact on yourself, your pupils, your colleagues or your school?’, it is striking that 36% felt their professional learning did not have very much impact or no impact at all on their school. All results for this question are shown in graph 31 (n=17).
<span id="es-chart-01" class="table_caption" style="text-align:center; margin: auto; display: block; padding-top: 3.5rem">Graph 31: Professional learning impact</span>

End of document
"
"
"
"
"
"
6
/
7